

4 Chalcophile (As, Cd, Cu, Hg, Ni, Pb, Zn) …
59
et al. 2016) and in sulfide ores and/or metal arsenates which are also present in
Albania, and respectively located in the South and in the Northern part of Albania
(Lazo et al. 2007).
The country differences of As content in moss samples were very high (CV% =
126% that were followed by high values of skeweness and kurtosis) by indicating a
high disparity in its distribution pattern throughout the country. It is probably sourced
by the local emission points and long-range atmospheric transport. The content of As
in moss samples ranged from 0.05 to 2.86 mg kg
−1 , with an average concentration
of 0.48 mg kg
−1 .
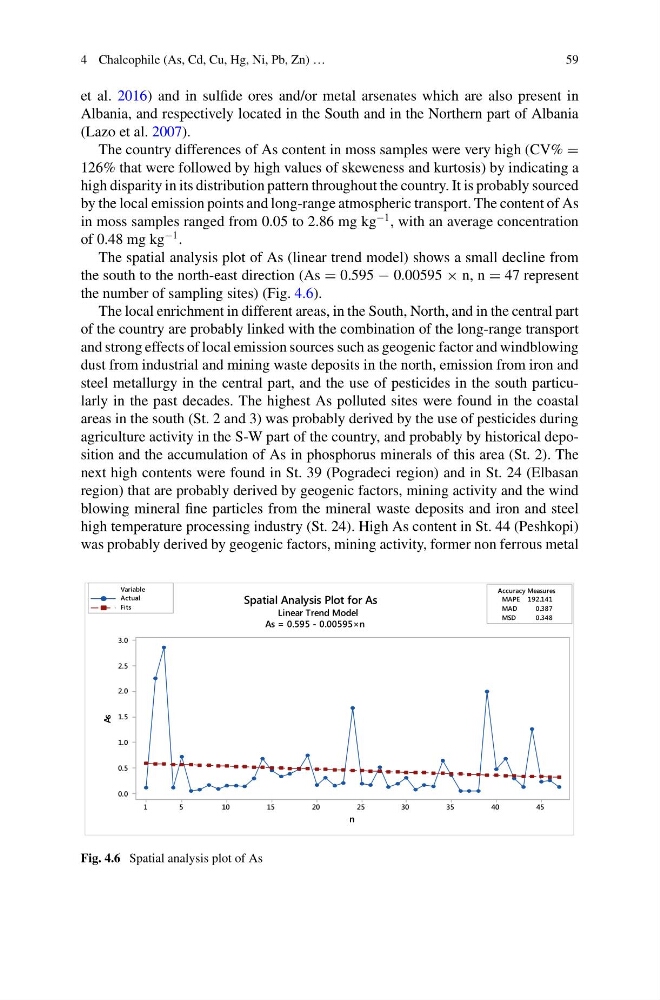
The spatial analysis plot of As (linear trend model) shows a small decline from
the south to the north-east direction (As = 0.595 − 0.00595 × n, n = 47 represent
the number of sampling sites) (Fig. 4.6).
The local enrichment in different areas, in the South, North, and in the central part
of the country are probably linked with the combination of the long-range transport
and strong effects of local emission sources such as geogenic factor and windblowing
dust from industrial and mining waste deposits in the north, emission from iron and
steel metallurgy in the central part, and the use of pesticides in the south particularly in the past decades. The highest As polluted sites were found in the coastal
areas in the south (St. 2 and 3) was probably derived by the use of pesticides during
agriculture activity in the S-W part of the country, and probably by historical deposition and the accumulation of As in phosphorus minerals of this area (St. 2). The
next high contents were found in St. 39 (Pogradeci region) and in St. 24 (Elbasan
region) that are probably derived by geogenic factors, mining activity and the wind
blowing mineral fine particles from the mineral waste deposits and iron and steel
high temperature processing industry (St. 24). High As content in St. 44 (Peshkopi)
was probably derived by geogenic factors, mining activity, former non ferrous metal
45
40
35
30
25
20
15
10
5
1
3.0
2.5
2.0
1.5
1.0
0.5
0.0
MAPE 192.141
MAD
0.387
MSD
0.348
Accuracy Measures
n
As
Actual
Fits
Variable
Spatial Analysis Plot for As
Linear Trend Model
As = 0.595 - 0.00595×n
Fig. 4.6 Spatial analysis plot of As
59
et al. 2016) and in sulfide ores and/or metal arsenates which are also present in
Albania, and respectively located in the South and in the Northern part of Albania
(Lazo et al. 2007).
The country differences of As content in moss samples were very high (CV% =
126% that were followed by high values of skeweness and kurtosis) by indicating a
high disparity in its distribution pattern throughout the country. It is probably sourced
by the local emission points and long-range atmospheric transport. The content of As
in moss samples ranged from 0.05 to 2.86 mg kg
−1 , with an average concentration
of 0.48 mg kg
−1 .
The spatial analysis plot of As (linear trend model) shows a small decline from
the south to the north-east direction (As = 0.595 − 0.00595 × n, n = 47 represent
the number of sampling sites) (Fig. 4.6).
The local enrichment in different areas, in the South, North, and in the central part
of the country are probably linked with the combination of the long-range transport
and strong effects of local emission sources such as geogenic factor and windblowing
dust from industrial and mining waste deposits in the north, emission from iron and
steel metallurgy in the central part, and the use of pesticides in the south particularly in the past decades. The highest As polluted sites were found in the coastal
areas in the south (St. 2 and 3) was probably derived by the use of pesticides during
agriculture activity in the S-W part of the country, and probably by historical deposition and the accumulation of As in phosphorus minerals of this area (St. 2). The
next high contents were found in St. 39 (Pogradeci region) and in St. 24 (Elbasan
region) that are probably derived by geogenic factors, mining activity and the wind
blowing mineral fine particles from the mineral waste deposits and iron and steel
high temperature processing industry (St. 24). High As content in St. 44 (Peshkopi)
was probably derived by geogenic factors, mining activity, former non ferrous metal
45
40
35
30
25
20
15
10
5
1
3.0
2.5
2.0
1.5
1.0
0.5
0.0
MAPE 192.141
MAD
0.387
MSD
0.348
Accuracy Measures
n
As
Actual
Fits
Variable
Spatial Analysis Plot for As
Linear Trend Model
As = 0.595 - 0.00595×n
Fig. 4.6 Spatial analysis plot of As