

56
P. Lazo et al.
mining industry in the north which may be enter atmosphere as wind blowing fine
soil and mineral particles. High-temperature processes in steel and iron industry,
municipal waste burning, and cement production could be in consideration as strong
anthropogenic emitters of Pb (Pacyna 1988) that enter in the atmosphere as fine
particulate matter from point sources. The chemical composition of the particulate
matter and the manner of the distribution of all sources regarding the space, place
or location, time, magnitude, characteristics of pollutants, and meteorological and
climatic conditions (Ávila-Pérez et al. 2018) may explain the associations between
the elements. On the other hand, traffic should be considered as a major contributor
to Pb emission.
4.4 Zinc, Zn
Zn is a widely distributed chemical element which is naturally occurring in the earth’s
crust. The Zn content in the moss samples ranged from 1.0 to 46.9 mg kg
−1 , with an
average content of 14.3 mg kg
−1 . The distribution of Zn throughout the whole country
looks like homogeneous. The same as Pb, the concentration of Zn in moss samples
of Albania was lower than the mosses of the most European countries (Harmens
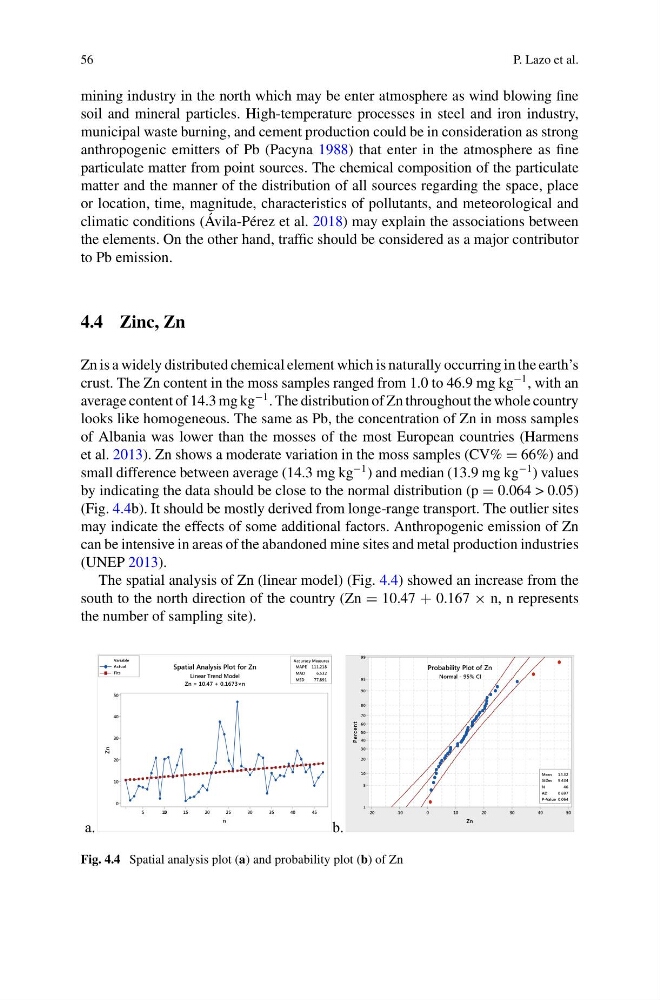
et al. 2013). Zn shows a moderate variation in the moss samples (CV% = 66%) and
small difference between average (14.3 mg kg
−1 ) and median (13.9 mg kg
−1 ) values
by indicating the data should be close to the normal distribution (p = 0.064 > 0.05)
(Fig. 4.4b). It should be mostly derived from longe-range transport. The outlier sites
may indicate the effects of some additional factors. Anthropogenic emission of Zn
can be intensive in areas of the abandoned mine sites and metal production industries
(UNEP 2013).
The spatial analysis of Zn (linear model) (Fig. 4.4) showed an increase from the
south to the north direction of the country (Zn = 10.47 + 0.167 × n, n represents
the number of sampling site).
.
b
.
a
45
40
35
30
25
20
15
10
5
1
50
40
30
20
10
0
MAPE 111.218
MAD
6.532
MSD
77.891
Accuracy Measures
n
Zn
Actual
Fits
Variable
Spatial Analysis Plot for Zn
Linear Trend Model
Zn = 10.47 + 0.1673×n
50
40
30
20
10
0
-10
-20
99
95
90
80
70
60
50
40
30
20
10
5
1
Mean
14.32
StDev 9.434
N
4 6
AD
0.697
P-Value 0.064
Zn
Percent
Probability Plot of Zn
Normal - 95% CI
Fig. 4.4 Spatial analysis plot (a) and probability plot (b) of Zn
P. Lazo et al.
mining industry in the north which may be enter atmosphere as wind blowing fine
soil and mineral particles. High-temperature processes in steel and iron industry,
municipal waste burning, and cement production could be in consideration as strong
anthropogenic emitters of Pb (Pacyna 1988) that enter in the atmosphere as fine
particulate matter from point sources. The chemical composition of the particulate
matter and the manner of the distribution of all sources regarding the space, place
or location, time, magnitude, characteristics of pollutants, and meteorological and
climatic conditions (Ávila-Pérez et al. 2018) may explain the associations between
the elements. On the other hand, traffic should be considered as a major contributor
to Pb emission.
4.4 Zinc, Zn
Zn is a widely distributed chemical element which is naturally occurring in the earth’s
crust. The Zn content in the moss samples ranged from 1.0 to 46.9 mg kg
−1 , with an
average content of 14.3 mg kg
−1 . The distribution of Zn throughout the whole country
looks like homogeneous. The same as Pb, the concentration of Zn in moss samples
of Albania was lower than the mosses of the most European countries (Harmens
et al. 2013). Zn shows a moderate variation in the moss samples (CV% = 66%) and
small difference between average (14.3 mg kg
−1 ) and median (13.9 mg kg
−1 ) values
by indicating the data should be close to the normal distribution (p = 0.064 > 0.05)
(Fig. 4.4b). It should be mostly derived from longe-range transport. The outlier sites
may indicate the effects of some additional factors. Anthropogenic emission of Zn
can be intensive in areas of the abandoned mine sites and metal production industries
(UNEP 2013).
The spatial analysis of Zn (linear model) (Fig. 4.4) showed an increase from the
south to the north direction of the country (Zn = 10.47 + 0.167 × n, n represents
the number of sampling site).
.
b
.
a
45
40
35
30
25
20
15
10
5
1
50
40
30
20
10
0
MAPE 111.218
MAD
6.532
MSD
77.891
Accuracy Measures
n
Zn
Actual
Fits
Variable
Spatial Analysis Plot for Zn
Linear Trend Model
Zn = 10.47 + 0.1673×n
50
40
30
20
10
0
-10
-20
99
95
90
80
70
60
50
40
30
20
10
5
1
Mean
14.32
StDev 9.434
N
4 6
AD
0.697
P-Value 0.064
Zn
Percent
Probability Plot of Zn
Normal - 95% CI
Fig. 4.4 Spatial analysis plot (a) and probability plot (b) of Zn