

3 The Evaluation of TM Atmospheric Deposition in Albania
45
45
40
35
30
25
20
15
10
5
1
1.2
1.0
0.8
0.6
0.4
0.2
0.0
MAPE 52.9785
MAD
0.1942
MSD
0.0629
Accuracy Measures
n
Th
Actual
Fits
Variable
Spatial Analysis Plot for Th
Linear Trend Model
Th = 0.551 - 0.0023×n
45
40
35
30
25
20
15
10
5
1
0.5
0.4
0.3
0.2
0.1
0.0
MAPE 54.1037
MAD
0.0646
MSD
0.0075
Accuracy Measures
n
U
Actual
Fits
Variable
Spatial Analysis Plot for U
Linear Trend Model
U = 0.148 + 0.0002×n
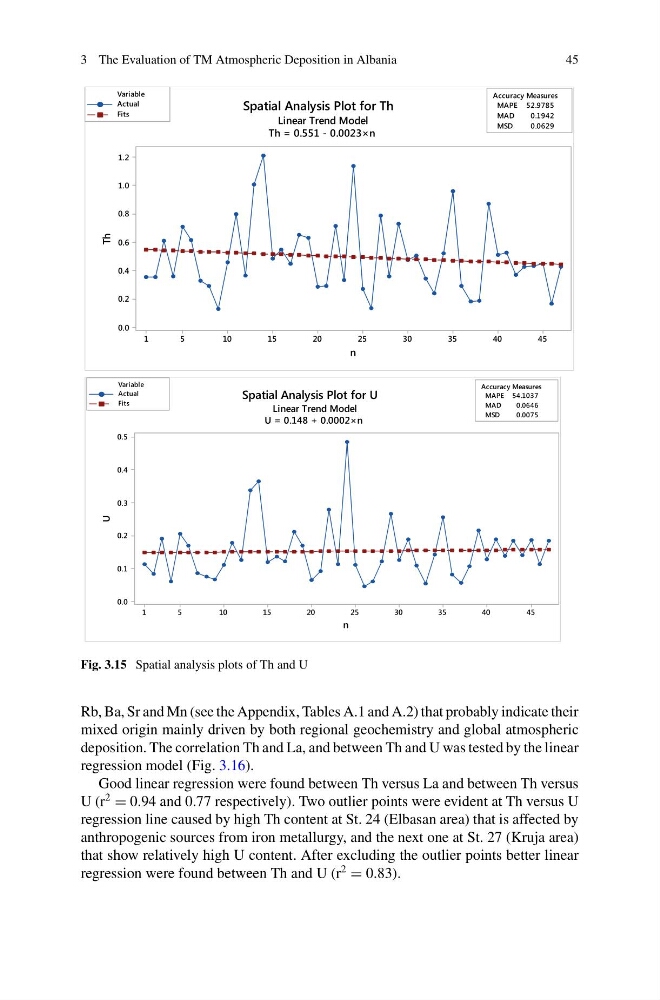
Fig. 3.15 Spatial analysis plots of Th and U
Rb, Ba, Sr and Mn (see the Appendix, Tables A.1 and A.2) that probably indicate their
mixed origin mainly driven by both regional geochemistry and global atmospheric
deposition. The correlation Th and La, and between Th and U was tested by the linear
regression model (Fig. 3.16).
Good linear regression were found between Th versus La and between Th versus
U (r
2
= 0.94 and 0.77 respectively). Two outlier points were evident at Th versus U
regression line caused by high Th content at St. 24 (Elbasan area) that is affected by
anthropogenic sources from iron metallurgy, and the next one at St. 27 (Kruja area)
that show relatively high U content. After excluding the outlier points better linear
regression were found between Th and U (r
2
= 0.83).
45
45
40
35
30
25
20
15
10
5
1
1.2
1.0
0.8
0.6
0.4
0.2
0.0
MAPE 52.9785
MAD
0.1942
MSD
0.0629
Accuracy Measures
n
Th
Actual
Fits
Variable
Spatial Analysis Plot for Th
Linear Trend Model
Th = 0.551 - 0.0023×n
45
40
35
30
25
20
15
10
5
1
0.5
0.4
0.3
0.2
0.1
0.0
MAPE 54.1037
MAD
0.0646
MSD
0.0075
Accuracy Measures
n
U
Actual
Fits
Variable
Spatial Analysis Plot for U
Linear Trend Model
U = 0.148 + 0.0002×n
Fig. 3.15 Spatial analysis plots of Th and U
Rb, Ba, Sr and Mn (see the Appendix, Tables A.1 and A.2) that probably indicate their
mixed origin mainly driven by both regional geochemistry and global atmospheric
deposition. The correlation Th and La, and between Th and U was tested by the linear
regression model (Fig. 3.16).
Good linear regression were found between Th versus La and between Th versus
U (r
2
= 0.94 and 0.77 respectively). Two outlier points were evident at Th versus U
regression line caused by high Th content at St. 24 (Elbasan area) that is affected by
anthropogenic sources from iron metallurgy, and the next one at St. 27 (Kruja area)
that show relatively high U content. After excluding the outlier points better linear
regression were found between Th and U (r
2
= 0.83).