

44
P. Lazo et al.
0.14
0.12
0.10
0.08
0.06
0.04
0.02
0.00
12
10
8
6
4
2
0
S
0.649797
R-Sq
90.8%
R-Sq(adj)
90.6%
Ta
Ce
Regression
95% CI
95% PI
Fitted Line Plot
Ce = 0.2409 + 65.90 Ta
0.14
0.12
0.10
0.08
0.06
0.04
0.02
0.00
1.0
0.8
0.6
0.4
0.2
0.0
S
0.0654808
R-Sq
86.3%
R-Sq(adj)
86.0%
Ta
Cs
Regression
95% CI
95% PI
Fitted Line Plot
Cs = - 0.00278 + 5.297 Ta
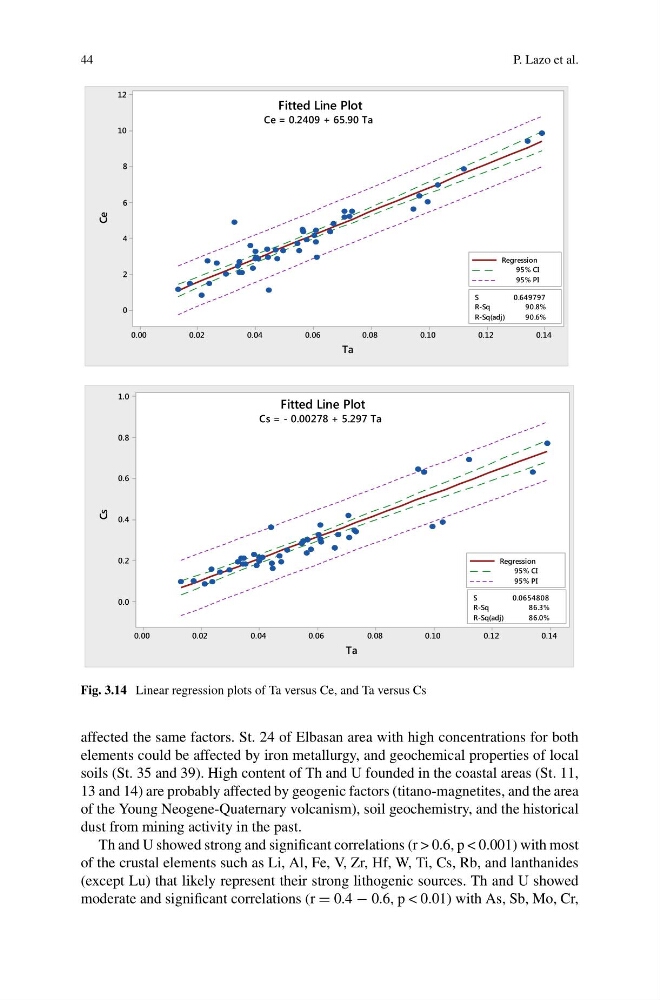
Fig. 3.14 Linear regression plots of Ta versus Ce, and Ta versus Cs
affected the same factors. St. 24 of Elbasan area with high concentrations for both
elements could be affected by iron metallurgy, and geochemical properties of local
soils (St. 35 and 39). High content of Th and U founded in the coastal areas (St. 11,
13 and 14) are probably affected by geogenic factors (titano-magnetites, and the area
of the Young Neogene-Quaternary volcanism), soil geochemistry, and the historical
dust from mining activity in the past.
Th and U showed strong and significant correlations (r > 0.6, p < 0.001) with most
of the crustal elements such as Li, Al, Fe, V, Zr, Hf, W, Ti, Cs, Rb, and lanthanides
(except Lu) that likely represent their strong lithogenic sources. Th and U showed
moderate and significant correlations (r = 0.4 − 0.6, p < 0.01) with As, Sb, Mo, Cr,
P. Lazo et al.
0.14
0.12
0.10
0.08
0.06
0.04
0.02
0.00
12
10
8
6
4
2
0
S
0.649797
R-Sq
90.8%
R-Sq(adj)
90.6%
Ta
Ce
Regression
95% CI
95% PI
Fitted Line Plot
Ce = 0.2409 + 65.90 Ta
0.14
0.12
0.10
0.08
0.06
0.04
0.02
0.00
1.0
0.8
0.6
0.4
0.2
0.0
S
0.0654808
R-Sq
86.3%
R-Sq(adj)
86.0%
Ta
Cs
Regression
95% CI
95% PI
Fitted Line Plot
Cs = - 0.00278 + 5.297 Ta
Fig. 3.14 Linear regression plots of Ta versus Ce, and Ta versus Cs
affected the same factors. St. 24 of Elbasan area with high concentrations for both
elements could be affected by iron metallurgy, and geochemical properties of local
soils (St. 35 and 39). High content of Th and U founded in the coastal areas (St. 11,
13 and 14) are probably affected by geogenic factors (titano-magnetites, and the area
of the Young Neogene-Quaternary volcanism), soil geochemistry, and the historical
dust from mining activity in the past.
Th and U showed strong and significant correlations (r > 0.6, p < 0.001) with most
of the crustal elements such as Li, Al, Fe, V, Zr, Hf, W, Ti, Cs, Rb, and lanthanides
(except Lu) that likely represent their strong lithogenic sources. Th and U showed
moderate and significant correlations (r = 0.4 − 0.6, p < 0.01) with As, Sb, Mo, Cr,