

36
P. Lazo et al.
25.1 mg kg
−1 , DW) > Hf (0.07 − 0.67 mg kg
−1 , DW), is probably an indication of the
lithogenic origin of these elements in current moss derived by local soil dust emission. Ti/Zr ratio in moss samples (average value of 28) is lower than of the chondrites
(Ti/Zr = 118) that indicate the geogenic effects of local area. At the same time, the
Zr/Hf ratios of moss samples ranged between 30 and 55 that probably indicate the
origin from granites and zirconium granites (Wang et al. 2010). The correlations
between Ti, Zr and Hf look likely very similar with the correlations of Ti, Zr and
Hf with other earth’s crust elements. All these findings may indicate their natural
source of origin as a dominant factor controlling their abundance in moss samples.
Zr and Hf show a moderate variation (CV % = 47 and 53% respectively) in present
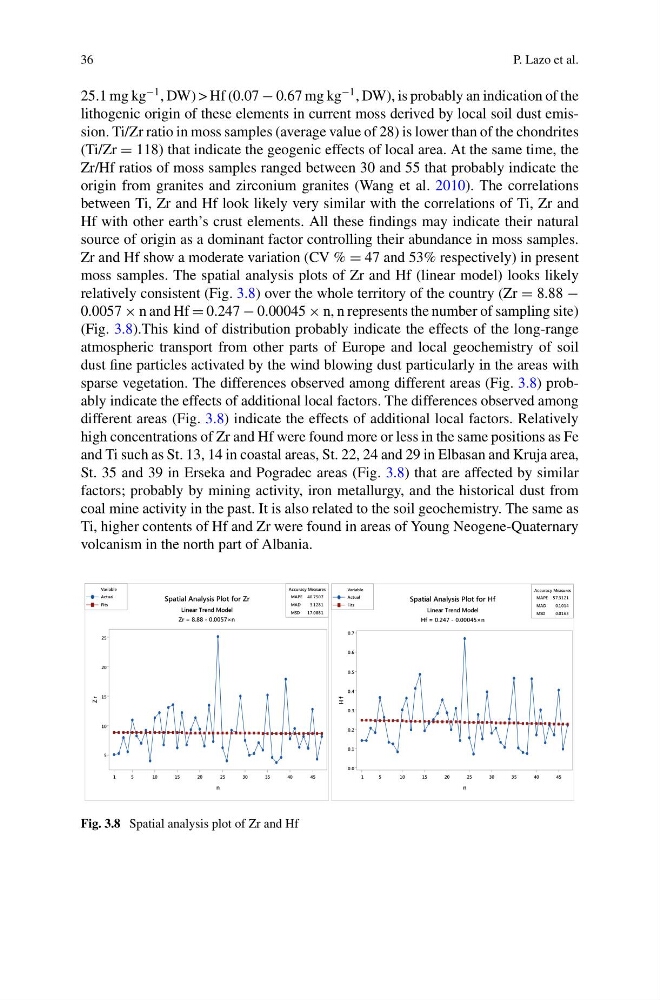
moss samples. The spatial analysis plots of Zr and Hf (linear model) looks likely
relatively consistent (Fig. 3.8) over the whole territory of the country (Zr = 8.88 −
0.0057 × n and Hf = 0.247 − 0.00045 × n, n represents the number of sampling site)
(Fig. 3.8).This kind of distribution probably indicate the effects of the long-range
atmospheric transport from other parts of Europe and local geochemistry of soil
dust fine particles activated by the wind blowing dust particularly in the areas with
sparse vegetation. The differences observed among different areas (Fig. 3.8) probably indicate the effects of additional local factors. The differences observed among
different areas (Fig. 3.8) indicate the effects of additional local factors. Relatively
high concentrations of Zr and Hf were found more or less in the same positions as Fe
and Ti such as St. 13, 14 in coastal areas, St. 22, 24 and 29 in Elbasan and Kruja area,
St. 35 and 39 in Erseka and Pogradec areas (Fig. 3.8) that are affected by similar
factors; probably by mining activity, iron metallurgy, and the historical dust from
coal mine activity in the past. It is also related to the soil geochemistry. The same as
Ti, higher contents of Hf and Zr were found in areas of Young Neogene-Quaternary
volcanism in the north part of Albania.
45
40
35
30
25
20
15
10
5
1
25
20
15
10
5
MAPE 40.7507
MAD
3.1281
MSD
17.0881
Accuracy Measures
n
Z r
Actual
Fits
Variable
Spatial Analysis Plot for Zr
Linear Trend Model
Zr = 8.88 - 0.0057×n
45
40
35
30
25
20
15
10
5
1
0.7
0.6
0.5
0.4
0.3
0.2
0.1
0.0
MAPE 57.3121
MAD
0.1014
MSD
0.0163
Accuracy Measures
n
H f
Actual
Fits
Variable
Spatial Analysis Plot for Hf
Linear Trend Model
Hf = 0.247 - 0.00045×n
Fig. 3.8 Spatial analysis plot of Zr and Hf
P. Lazo et al.
25.1 mg kg
−1 , DW) > Hf (0.07 − 0.67 mg kg
−1 , DW), is probably an indication of the
lithogenic origin of these elements in current moss derived by local soil dust emission. Ti/Zr ratio in moss samples (average value of 28) is lower than of the chondrites
(Ti/Zr = 118) that indicate the geogenic effects of local area. At the same time, the
Zr/Hf ratios of moss samples ranged between 30 and 55 that probably indicate the
origin from granites and zirconium granites (Wang et al. 2010). The correlations
between Ti, Zr and Hf look likely very similar with the correlations of Ti, Zr and
Hf with other earth’s crust elements. All these findings may indicate their natural
source of origin as a dominant factor controlling their abundance in moss samples.
Zr and Hf show a moderate variation (CV % = 47 and 53% respectively) in present
moss samples. The spatial analysis plots of Zr and Hf (linear model) looks likely
relatively consistent (Fig. 3.8) over the whole territory of the country (Zr = 8.88 −
0.0057 × n and Hf = 0.247 − 0.00045 × n, n represents the number of sampling site)
(Fig. 3.8).This kind of distribution probably indicate the effects of the long-range
atmospheric transport from other parts of Europe and local geochemistry of soil
dust fine particles activated by the wind blowing dust particularly in the areas with
sparse vegetation. The differences observed among different areas (Fig. 3.8) probably indicate the effects of additional local factors. The differences observed among
different areas (Fig. 3.8) indicate the effects of additional local factors. Relatively
high concentrations of Zr and Hf were found more or less in the same positions as Fe
and Ti such as St. 13, 14 in coastal areas, St. 22, 24 and 29 in Elbasan and Kruja area,
St. 35 and 39 in Erseka and Pogradec areas (Fig. 3.8) that are affected by similar
factors; probably by mining activity, iron metallurgy, and the historical dust from
coal mine activity in the past. It is also related to the soil geochemistry. The same as
Ti, higher contents of Hf and Zr were found in areas of Young Neogene-Quaternary
volcanism in the north part of Albania.
45
40
35
30
25
20
15
10
5
1
25
20
15
10
5
MAPE 40.7507
MAD
3.1281
MSD
17.0881
Accuracy Measures
n
Z r
Actual
Fits
Variable
Spatial Analysis Plot for Zr
Linear Trend Model
Zr = 8.88 - 0.0057×n
45
40
35
30
25
20
15
10
5
1
0.7
0.6
0.5
0.4
0.3
0.2
0.1
0.0
MAPE 57.3121
MAD
0.1014
MSD
0.0163
Accuracy Measures
n
H f
Actual
Fits
Variable
Spatial Analysis Plot for Hf
Linear Trend Model
Hf = 0.247 - 0.00045×n
Fig. 3.8 Spatial analysis plot of Zr and Hf