

26
P. Lazo et al.
10
8
6
4
2
0
12
10
8
6
4
2
0
Mean 3.813
StDev 1.927
N
4 8
V
Frequency
Histogram (with Normal Curve) of V
0.6
0.5
0.4
0.3
0.2
0.1
-0.0
10
8
6
4
2
0
Mean 0.2739
StDev 0.1244
N
4 8
Mo
Frequency
Histogram (with Normal Curve) of Mo
0.20
0.16
0.12
0.08
0.04
20
15
10
5
0
Mean 0.08651
StDev 0.02778
N
4 8
Ag
Frequency
Histogram (with Normal Curve) of Ag
1600
1200
800
400
20
15
10
5
0
Mean 791.1
StDev 299.7
N
4 8
P
Frequency
Histogram (with Normal Curve) of P
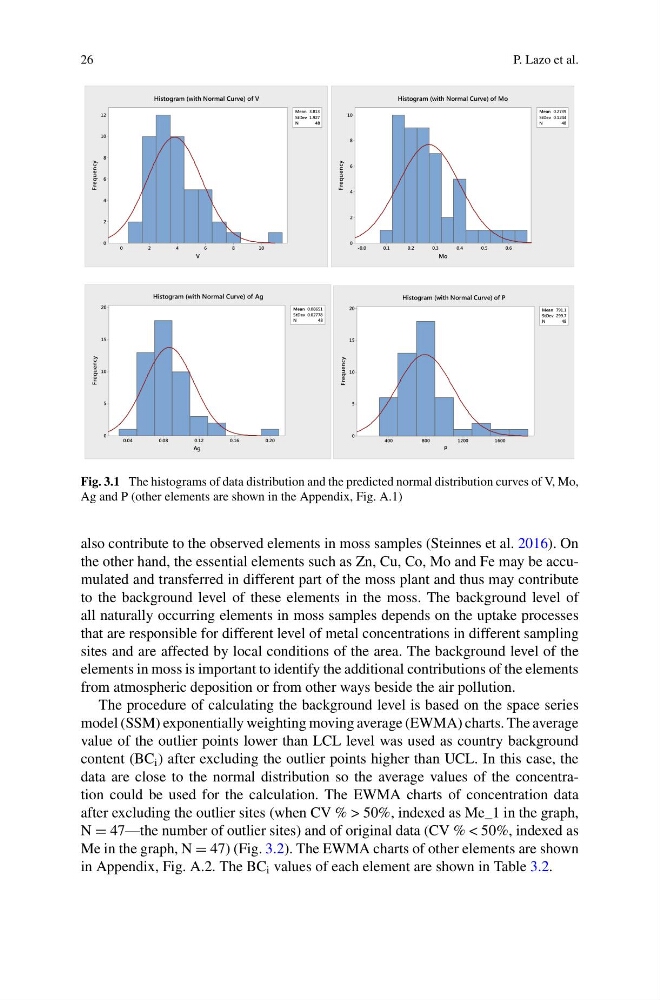
Fig. 3.1 The histograms of data distribution and the predicted normal distribution curves of V, Mo,
Ag and P (other elements are shown in the Appendix, Fig. A.1)
also contribute to the observed elements in moss samples (Steinnes et al. 2016). On
the other hand, the essential elements such as Zn, Cu, Co, Mo and Fe may be accumulated and transferred in different part of the moss plant and thus may contribute
to the background level of these elements in the moss. The background level of
all naturally occurring elements in moss samples depends on the uptake processes
that are responsible for different level of metal concentrations in different sampling
sites and are affected by local conditions of the area. The background level of the
elements in moss is important to identify the additional contributions of the elements
from atmospheric deposition or from other ways beside the air pollution.
The procedure of calculating the background level is based on the space series
model (SSM) exponentially weighting moving average (EWMA) charts. The average
value of the outlier points lower than LCL level was used as country background
content (BC i ) after excluding the outlier points higher than UCL. In this case, the
data are close to the normal distribution so the average values of the concentration could be used for the calculation. The EWMA charts of concentration data
after excluding the outlier sites (when CV % > 50%, indexed as Me_1 in the graph,
N = 47—the number of outlier sites) and of original data (CV % < 50%, indexed as
Me in the graph, N = 47) (Fig. 3.2). The EWMA charts of other elements are shown
in Appendix, Fig. A.2. The BC i values of each element are shown in Table 3.2.
P. Lazo et al.
10
8
6
4
2
0
12
10
8
6
4
2
0
Mean 3.813
StDev 1.927
N
4 8
V
Frequency
Histogram (with Normal Curve) of V
0.6
0.5
0.4
0.3
0.2
0.1
-0.0
10
8
6
4
2
0
Mean 0.2739
StDev 0.1244
N
4 8
Mo
Frequency
Histogram (with Normal Curve) of Mo
0.20
0.16
0.12
0.08
0.04
20
15
10
5
0
Mean 0.08651
StDev 0.02778
N
4 8
Ag
Frequency
Histogram (with Normal Curve) of Ag
1600
1200
800
400
20
15
10
5
0
Mean 791.1
StDev 299.7
N
4 8
P
Frequency
Histogram (with Normal Curve) of P
Fig. 3.1 The histograms of data distribution and the predicted normal distribution curves of V, Mo,
Ag and P (other elements are shown in the Appendix, Fig. A.1)
also contribute to the observed elements in moss samples (Steinnes et al. 2016). On
the other hand, the essential elements such as Zn, Cu, Co, Mo and Fe may be accumulated and transferred in different part of the moss plant and thus may contribute
to the background level of these elements in the moss. The background level of
all naturally occurring elements in moss samples depends on the uptake processes
that are responsible for different level of metal concentrations in different sampling
sites and are affected by local conditions of the area. The background level of the
elements in moss is important to identify the additional contributions of the elements
from atmospheric deposition or from other ways beside the air pollution.
The procedure of calculating the background level is based on the space series
model (SSM) exponentially weighting moving average (EWMA) charts. The average
value of the outlier points lower than LCL level was used as country background
content (BC i ) after excluding the outlier points higher than UCL. In this case, the
data are close to the normal distribution so the average values of the concentration could be used for the calculation. The EWMA charts of concentration data
after excluding the outlier sites (when CV % > 50%, indexed as Me_1 in the graph,
N = 47—the number of outlier sites) and of original data (CV % < 50%, indexed as
Me in the graph, N = 47) (Fig. 3.2). The EWMA charts of other elements are shown
in Appendix, Fig. A.2. The BC i values of each element are shown in Table 3.2.