

7 The Siliceous, Si and Phosphorus, P
87
45
40
35
30
25
20
15
10
5
1
2000
1750
1500
1250
1000
750
500
MAPE
28.5
MAD
213.5
MSD
89734.8
Accuracy Measures
n
P
Actual
Fits
Variable
Spatial Analysis Plot for P
Linear Trend Model
P = 789.6 - 0.24×n
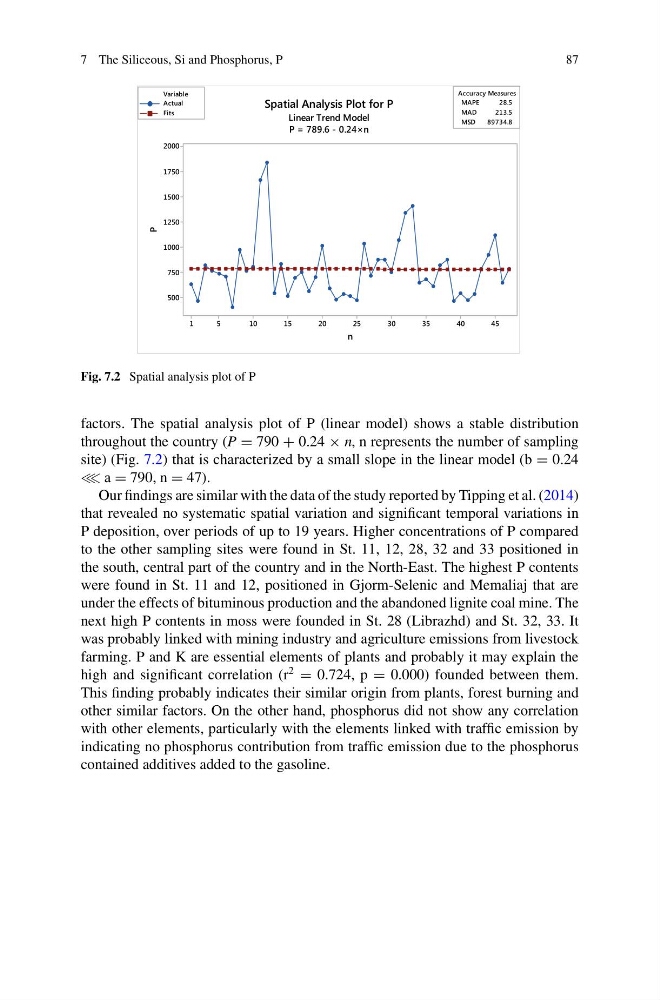
Fig. 7.2 Spatial analysis plot of P
factors. The spatial analysis plot of P (linear model) shows a stable distribution
throughout the country (P = 790 + 0.24 × n, n represents the number of sampling
site) (Fig. 7.2) that is characterized by a small slope in the linear model (b = 0.24
≪ a = 790, n = 47).
Our findings are similar with the data of the study reported by Tipping et al. (2014)
that revealed no systematic spatial variation and significant temporal variations in
P deposition, over periods of up to 19 years. Higher concentrations of P compared
to the other sampling sites were found in St. 11, 12, 28, 32 and 33 positioned in
the south, central part of the country and in the North-East. The highest P contents
were found in St. 11 and 12, positioned in Gjorm-Selenic and Memaliaj that are
under the effects of bituminous production and the abandoned lignite coal mine. The
next high P contents in moss were founded in St. 28 (Librazhd) and St. 32, 33. It
was probably linked with mining industry and agriculture emissions from livestock
farming. P and K are essential elements of plants and probably it may explain the
high and significant correlation (r
2
= 0.724, p = 0.000) founded between them.
This finding probably indicates their similar origin from plants, forest burning and
other similar factors. On the other hand, phosphorus did not show any correlation
with other elements, particularly with the elements linked with traffic emission by
indicating no phosphorus contribution from traffic emission due to the phosphorus
contained additives added to the gasoline.
87
45
40
35
30
25
20
15
10
5
1
2000
1750
1500
1250
1000
750
500
MAPE
28.5
MAD
213.5
MSD
89734.8
Accuracy Measures
n
P
Actual
Fits
Variable
Spatial Analysis Plot for P
Linear Trend Model
P = 789.6 - 0.24×n
Fig. 7.2 Spatial analysis plot of P
factors. The spatial analysis plot of P (linear model) shows a stable distribution
throughout the country (P = 790 + 0.24 × n, n represents the number of sampling
site) (Fig. 7.2) that is characterized by a small slope in the linear model (b = 0.24
≪ a = 790, n = 47).
Our findings are similar with the data of the study reported by Tipping et al. (2014)
that revealed no systematic spatial variation and significant temporal variations in
P deposition, over periods of up to 19 years. Higher concentrations of P compared
to the other sampling sites were found in St. 11, 12, 28, 32 and 33 positioned in
the south, central part of the country and in the North-East. The highest P contents
were found in St. 11 and 12, positioned in Gjorm-Selenic and Memaliaj that are
under the effects of bituminous production and the abandoned lignite coal mine. The
next high P contents in moss were founded in St. 28 (Librazhd) and St. 32, 33. It
was probably linked with mining industry and agriculture emissions from livestock
farming. P and K are essential elements of plants and probably it may explain the
high and significant correlation (r
2
= 0.724, p = 0.000) founded between them.
This finding probably indicates their similar origin from plants, forest burning and
other similar factors. On the other hand, phosphorus did not show any correlation
with other elements, particularly with the elements linked with traffic emission by
indicating no phosphorus contribution from traffic emission due to the phosphorus
contained additives added to the gasoline.