

86
P. Lazo et al.
45
40
35
30
25
20
15
10
5
1
60000
50000
40000
30000
20000
10000
MAPE
36
MAD
9350
MSD
126915263
Accuracy Measures
n
Si
Actual
Fits
Variable
Spatial Analysis Plot for Si
Linear Trend Model
Si = 34659 - 130×n
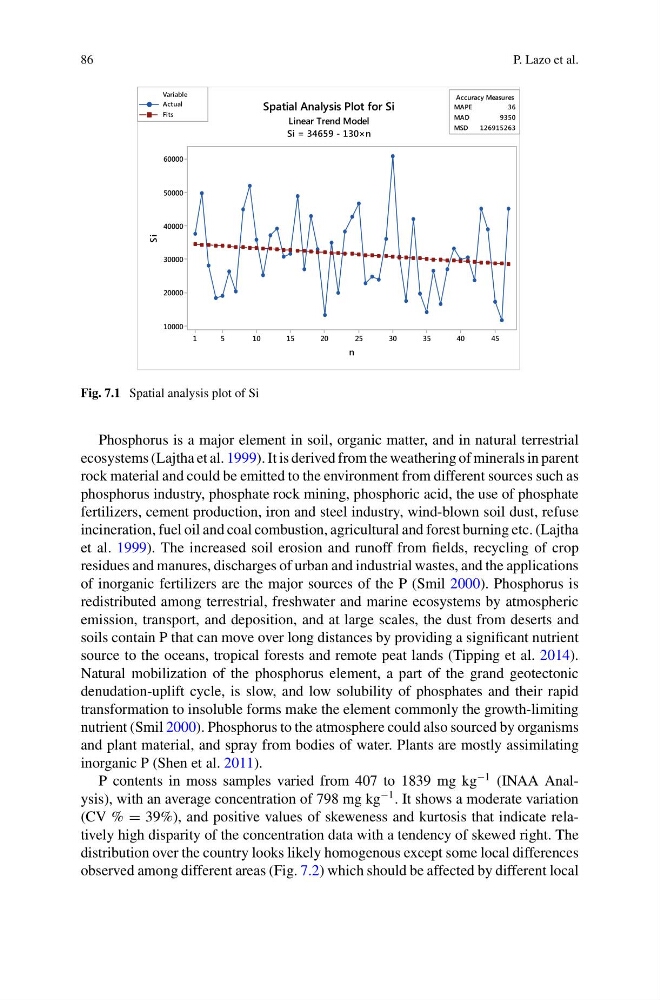
Fig. 7.1 Spatial analysis plot of Si
Phosphorus is a major element in soil, organic matter, and in natural terrestrial
ecosystems (Lajtha et al. 1999). It is derived from the weathering of minerals in parent
rock material and could be emitted to the environment from different sources such as
phosphorus industry, phosphate rock mining, phosphoric acid, the use of phosphate
fertilizers, cement production, iron and steel industry, wind-blown soil dust, refuse
incineration, fuel oil and coal combustion, agricultural and forest burning etc. (Lajtha
et al. 1999). The increased soil erosion and runoff from fields, recycling of crop
residues and manures, discharges of urban and industrial wastes, and the applications
of inorganic fertilizers are the major sources of the P (Smil 2000). Phosphorus is
redistributed among terrestrial, freshwater and marine ecosystems by atmospheric
emission, transport, and deposition, and at large scales, the dust from deserts and
soils contain P that can move over long distances by providing a significant nutrient
source to the oceans, tropical forests and remote peat lands (Tipping et al. 2014).
Natural mobilization of the phosphorus element, a part of the grand geotectonic
denudation-uplift cycle, is slow, and low solubility of phosphates and their rapid
transformation to insoluble forms make the element commonly the growth-limiting
nutrient (Smil 2000). Phosphorus to the atmosphere could also sourced by organisms
and plant material, and spray from bodies of water. Plants are mostly assimilating
inorganic P (Shen et al. 2011).
P contents in moss samples varied from 407 to 1839 mg kg
−1 (INAA Analysis), with an average concentration of 798 mg kg
−1 . It shows a moderate variation
(CV % = 39%), and positive values of skeweness and kurtosis that indicate relatively high disparity of the concentration data with a tendency of skewed right. The
distribution over the country looks likely homogenous except some local differences
observed among different areas (Fig. 7.2) which should be affected by different local
P. Lazo et al.
45
40
35
30
25
20
15
10
5
1
60000
50000
40000
30000
20000
10000
MAPE
36
MAD
9350
MSD
126915263
Accuracy Measures
n
Si
Actual
Fits
Variable
Spatial Analysis Plot for Si
Linear Trend Model
Si = 34659 - 130×n
Fig. 7.1 Spatial analysis plot of Si
Phosphorus is a major element in soil, organic matter, and in natural terrestrial
ecosystems (Lajtha et al. 1999). It is derived from the weathering of minerals in parent
rock material and could be emitted to the environment from different sources such as
phosphorus industry, phosphate rock mining, phosphoric acid, the use of phosphate
fertilizers, cement production, iron and steel industry, wind-blown soil dust, refuse
incineration, fuel oil and coal combustion, agricultural and forest burning etc. (Lajtha
et al. 1999). The increased soil erosion and runoff from fields, recycling of crop
residues and manures, discharges of urban and industrial wastes, and the applications
of inorganic fertilizers are the major sources of the P (Smil 2000). Phosphorus is
redistributed among terrestrial, freshwater and marine ecosystems by atmospheric
emission, transport, and deposition, and at large scales, the dust from deserts and
soils contain P that can move over long distances by providing a significant nutrient
source to the oceans, tropical forests and remote peat lands (Tipping et al. 2014).
Natural mobilization of the phosphorus element, a part of the grand geotectonic
denudation-uplift cycle, is slow, and low solubility of phosphates and their rapid
transformation to insoluble forms make the element commonly the growth-limiting
nutrient (Smil 2000). Phosphorus to the atmosphere could also sourced by organisms
and plant material, and spray from bodies of water. Plants are mostly assimilating
inorganic P (Shen et al. 2011).
P contents in moss samples varied from 407 to 1839 mg kg
−1 (INAA Analysis), with an average concentration of 798 mg kg
−1 . It shows a moderate variation
(CV % = 39%), and positive values of skeweness and kurtosis that indicate relatively high disparity of the concentration data with a tendency of skewed right. The
distribution over the country looks likely homogenous except some local differences
observed among different areas (Fig. 7.2) which should be affected by different local