

6 Sea Spray Elements (Na, Cl, Mg, Ca, K, Br, I)
83
45
40
35
30
25
20
15
10
5
1
5000
4000
3000
2000
1000
MAPE
30
MAD
726
MSD
709308
Accuracy Measures
n
M g
Actual
Fits
Variable
Spatial Analysis Plot for Mg
Linear Trend Model
Mg = 1978 + 37.22×n
45
40
35
30
25
20
15
10
5
1
13000
12000
11000
10000
9000
8000
7000
6000
5000
4000
MAPE
17
MAD
1197
MSD
2589603
Accuracy Measures
n
Ca
Actual
Fits
Variable
Spatial Analysis Plot for Ca
Linear Trend Model
Ca = 7120 - 8.9×n
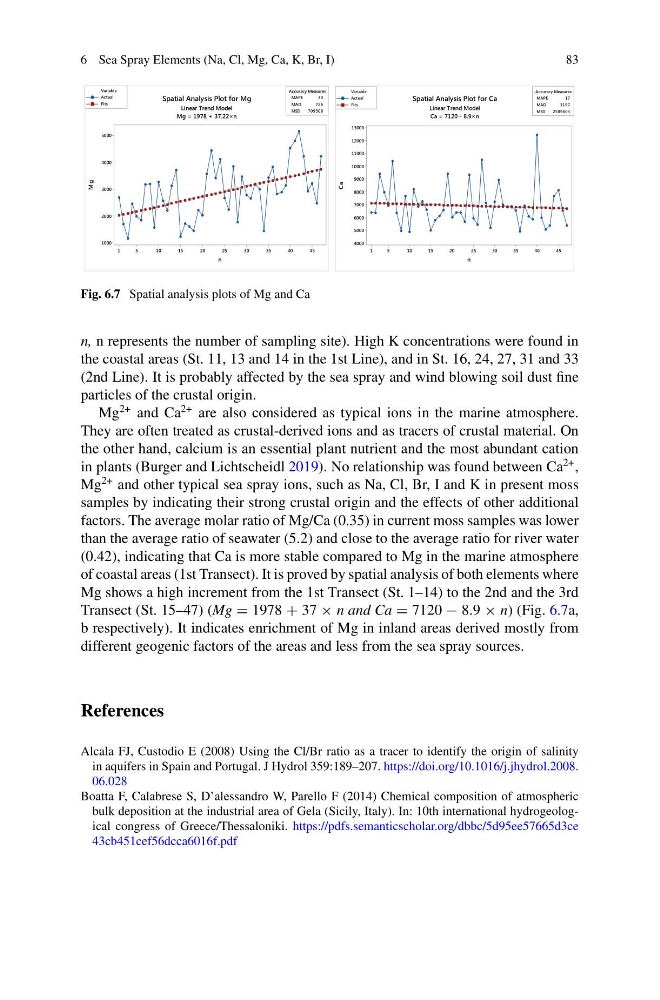
Fig. 6.7 Spatial analysis plots of Mg and Ca
n, n represents the number of sampling site). High K concentrations were found in
the coastal areas (St. 11, 13 and 14 in the 1st Line), and in St. 16, 24, 27, 31 and 33
(2nd Line). It is probably affected by the sea spray and wind blowing soil dust fine
particles of the crustal origin.
Mg
2+ and Ca
2+ are also considered as typical ions in the marine atmosphere.
They are often treated as crustal-derived ions and as tracers of crustal material. On
the other hand, calcium is an essential plant nutrient and the most abundant cation
in plants (Burger and Lichtscheidl 2019). No relationship was found between Ca
2+ ,
Mg
2+ and other typical sea spray ions, such as Na, Cl, Br, I and K in present moss
samples by indicating their strong crustal origin and the effects of other additional
factors. The average molar ratio of Mg/Ca (0.35) in current moss samples was lower
than the average ratio of seawater (5.2) and close to the average ratio for river water
(0.42), indicating that Ca is more stable compared to Mg in the marine atmosphere
of coastal areas (1st Transect). It is proved by spatial analysis of both elements where
Mg shows a high increment from the 1st Transect (St. 1–14) to the 2nd and the 3rd
Transect (St. 15–47) (Mg = 1978 + 37 × n and Ca = 7120 − 8.9 × n) (Fig. 6.7a,
b respectively). It indicates enrichment of Mg in inland areas derived mostly from
different geogenic factors of the areas and less from the sea spray sources.
References
Alcala FJ, Custodio E (2008) Using the Cl/Br ratio as a tracer to identify the origin of salinity
in aquifers in Spain and Portugal. J Hydrol 359:189–207. https://doi.org/10.1016/j.jhydrol.2008.
06.028
Boatta F, Calabrese S, D’alessandro W, Parello F (2014) Chemical composition of atmospheric
bulk deposition at the industrial area of Gela (Sicily, Italy). In: 10th international hydrogeological congress of Greece/Thessaloniki. https://pdfs.semanticscholar.org/dbbc/5d95ee57665d3ce
43cb451cef56dcca6016f.pdf
83
45
40
35
30
25
20
15
10
5
1
5000
4000
3000
2000
1000
MAPE
30
MAD
726
MSD
709308
Accuracy Measures
n
M g
Actual
Fits
Variable
Spatial Analysis Plot for Mg
Linear Trend Model
Mg = 1978 + 37.22×n
45
40
35
30
25
20
15
10
5
1
13000
12000
11000
10000
9000
8000
7000
6000
5000
4000
MAPE
17
MAD
1197
MSD
2589603
Accuracy Measures
n
Ca
Actual
Fits
Variable
Spatial Analysis Plot for Ca
Linear Trend Model
Ca = 7120 - 8.9×n
Fig. 6.7 Spatial analysis plots of Mg and Ca
n, n represents the number of sampling site). High K concentrations were found in
the coastal areas (St. 11, 13 and 14 in the 1st Line), and in St. 16, 24, 27, 31 and 33
(2nd Line). It is probably affected by the sea spray and wind blowing soil dust fine
particles of the crustal origin.
Mg
2+ and Ca
2+ are also considered as typical ions in the marine atmosphere.
They are often treated as crustal-derived ions and as tracers of crustal material. On
the other hand, calcium is an essential plant nutrient and the most abundant cation
in plants (Burger and Lichtscheidl 2019). No relationship was found between Ca
2+ ,
Mg
2+ and other typical sea spray ions, such as Na, Cl, Br, I and K in present moss
samples by indicating their strong crustal origin and the effects of other additional
factors. The average molar ratio of Mg/Ca (0.35) in current moss samples was lower
than the average ratio of seawater (5.2) and close to the average ratio for river water
(0.42), indicating that Ca is more stable compared to Mg in the marine atmosphere
of coastal areas (1st Transect). It is proved by spatial analysis of both elements where
Mg shows a high increment from the 1st Transect (St. 1–14) to the 2nd and the 3rd
Transect (St. 15–47) (Mg = 1978 + 37 × n and Ca = 7120 − 8.9 × n) (Fig. 6.7a,
b respectively). It indicates enrichment of Mg in inland areas derived mostly from
different geogenic factors of the areas and less from the sea spray sources.
References
Alcala FJ, Custodio E (2008) Using the Cl/Br ratio as a tracer to identify the origin of salinity
in aquifers in Spain and Portugal. J Hydrol 359:189–207. https://doi.org/10.1016/j.jhydrol.2008.
06.028
Boatta F, Calabrese S, D’alessandro W, Parello F (2014) Chemical composition of atmospheric
bulk deposition at the industrial area of Gela (Sicily, Italy). In: 10th international hydrogeological congress of Greece/Thessaloniki. https://pdfs.semanticscholar.org/dbbc/5d95ee57665d3ce
43cb451cef56dcca6016f.pdf