

A Model for the Assessment of the Water Footprint …
81
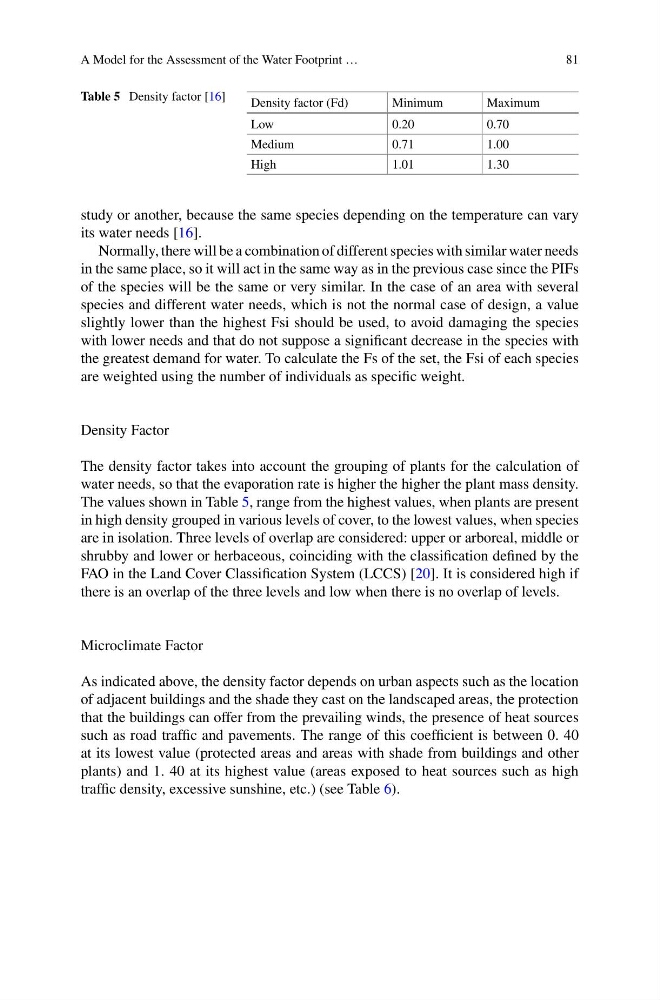
Table 5 Density factor [16]
Density factor (Fd)
Minimum
Maximum
Low
0.20
0.70
Medium
0.71
1.00
High
1.01
1.30
study or another, because the same species depending on the temperature can vary
its water needs [16].
Normally, there will be a combination of different species with similar water needs
in the same place, so it will act in the same way as in the previous case since the PIFs
of the species will be the same or very similar. In the case of an area with several
species and different water needs, which is not the normal case of design, a value
slightly lower than the highest Fsi should be used, to avoid damaging the species
with lower needs and that do not suppose a significant decrease in the species with
the greatest demand for water. To calculate the Fs of the set, the Fsi of each species
are weighted using the number of individuals as specific weight.
Density Factor
The density factor takes into account the grouping of plants for the calculation of
water needs, so that the evaporation rate is higher the higher the plant mass density.
The values shown in Table 5, range from the highest values, when plants are present
in high density grouped in various levels of cover, to the lowest values, when species
are in isolation. Three levels of overlap are considered: upper or arboreal, middle or
shrubby and lower or herbaceous, coinciding with the classification defined by the
FAO in the Land Cover Classification System (LCCS) [20]. It is considered high if
there is an overlap of the three levels and low when there is no overlap of levels.
Microclimate Factor
As indicated above, the density factor depends on urban aspects such as the location
of adjacent buildings and the shade they cast on the landscaped areas, the protection
that the buildings can offer from the prevailing winds, the presence of heat sources
such as road traffic and pavements. The range of this coefficient is between 0. 40
at its lowest value (protected areas and areas with shade from buildings and other
plants) and 1. 40 at its highest value (areas exposed to heat sources such as high
traffic density, excessive sunshine, etc.) (see Table 6).
81
Table 5 Density factor [16]
Density factor (Fd)
Minimum
Maximum
Low
0.20
0.70
Medium
0.71
1.00
High
1.01
1.30
study or another, because the same species depending on the temperature can vary
its water needs [16].
Normally, there will be a combination of different species with similar water needs
in the same place, so it will act in the same way as in the previous case since the PIFs
of the species will be the same or very similar. In the case of an area with several
species and different water needs, which is not the normal case of design, a value
slightly lower than the highest Fsi should be used, to avoid damaging the species
with lower needs and that do not suppose a significant decrease in the species with
the greatest demand for water. To calculate the Fs of the set, the Fsi of each species
are weighted using the number of individuals as specific weight.
Density Factor
The density factor takes into account the grouping of plants for the calculation of
water needs, so that the evaporation rate is higher the higher the plant mass density.
The values shown in Table 5, range from the highest values, when plants are present
in high density grouped in various levels of cover, to the lowest values, when species
are in isolation. Three levels of overlap are considered: upper or arboreal, middle or
shrubby and lower or herbaceous, coinciding with the classification defined by the
FAO in the Land Cover Classification System (LCCS) [20]. It is considered high if
there is an overlap of the three levels and low when there is no overlap of levels.
Microclimate Factor
As indicated above, the density factor depends on urban aspects such as the location
of adjacent buildings and the shade they cast on the landscaped areas, the protection
that the buildings can offer from the prevailing winds, the presence of heat sources
such as road traffic and pavements. The range of this coefficient is between 0. 40
at its lowest value (protected areas and areas with shade from buildings and other
plants) and 1. 40 at its highest value (areas exposed to heat sources such as high
traffic density, excessive sunshine, etc.) (see Table 6).