

30
C. M. Flores-Cayuela et al.
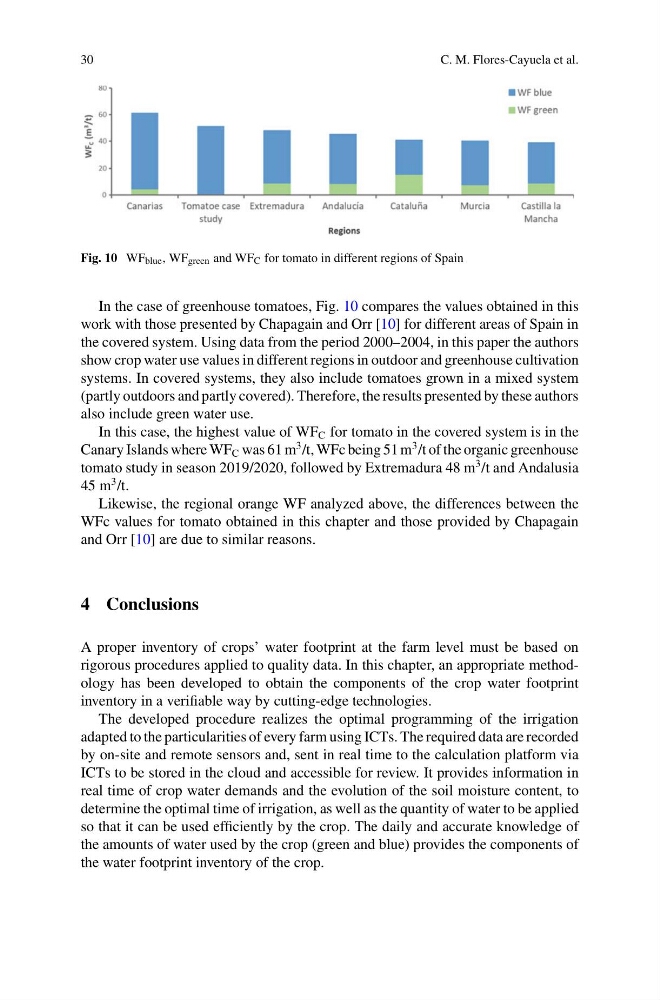
Fig. 10 WF blue , WF green and WF C for tomato in different regions of Spain
In the case of greenhouse tomatoes, Fig. 10 compares the values obtained in this
work with those presented by Chapagain and Orr [10] for different areas of Spain in
the covered system. Using data from the period 2000–2004, in this paper the authors
show crop water use values in different regions in outdoor and greenhouse cultivation
systems. In covered systems, they also include tomatoes grown in a mixed system
(partly outdoors and partly covered). Therefore, the results presented by these authors
also include green water use.
In this case, the highest value of WF C for tomato in the covered system is in the
Canary Islands where WF C was 61 m
3 /t, WFc being 51 m
3 /t of the organic greenhouse
tomato study in season 2019/2020, followed by Extremadura 48 m
3 /t and Andalusia
45 m
3 /t.
Likewise, the regional orange WF analyzed above, the differences between the
WFc values for tomato obtained in this chapter and those provided by Chapagain
and Orr [10] are due to similar reasons.
4 Conclusions
A proper inventory of crops’ water footprint at the farm level must be based on
rigorous procedures applied to quality data. In this chapter, an appropriate methodology has been developed to obtain the components of the crop water footprint
inventory in a verifiable way by cutting-edge technologies.
The developed procedure realizes the optimal programming of the irrigation
adapted to the particularities of every farm using ICTs. The required data are recorded
by on-site and remote sensors and, sent in real time to the calculation platform via
ICTs to be stored in the cloud and accessible for review. It provides information in
real time of crop water demands and the evolution of the soil moisture content, to
determine the optimal time of irrigation, as well as the quantity of water to be applied
so that it can be used efficiently by the crop. The daily and accurate knowledge of
the amounts of water used by the crop (green and blue) provides the components of
the water footprint inventory of the crop.
C. M. Flores-Cayuela et al.
Fig. 10 WF blue , WF green and WF C for tomato in different regions of Spain
In the case of greenhouse tomatoes, Fig. 10 compares the values obtained in this
work with those presented by Chapagain and Orr [10] for different areas of Spain in
the covered system. Using data from the period 2000–2004, in this paper the authors
show crop water use values in different regions in outdoor and greenhouse cultivation
systems. In covered systems, they also include tomatoes grown in a mixed system
(partly outdoors and partly covered). Therefore, the results presented by these authors
also include green water use.
In this case, the highest value of WF C for tomato in the covered system is in the
Canary Islands where WF C was 61 m
3 /t, WFc being 51 m
3 /t of the organic greenhouse
tomato study in season 2019/2020, followed by Extremadura 48 m
3 /t and Andalusia
45 m
3 /t.
Likewise, the regional orange WF analyzed above, the differences between the
WFc values for tomato obtained in this chapter and those provided by Chapagain
and Orr [10] are due to similar reasons.
4 Conclusions
A proper inventory of crops’ water footprint at the farm level must be based on
rigorous procedures applied to quality data. In this chapter, an appropriate methodology has been developed to obtain the components of the crop water footprint
inventory in a verifiable way by cutting-edge technologies.
The developed procedure realizes the optimal programming of the irrigation
adapted to the particularities of every farm using ICTs. The required data are recorded
by on-site and remote sensors and, sent in real time to the calculation platform via
ICTs to be stored in the cloud and accessible for review. It provides information in
real time of crop water demands and the evolution of the soil moisture content, to
determine the optimal time of irrigation, as well as the quantity of water to be applied
so that it can be used efficiently by the crop. The daily and accurate knowledge of
the amounts of water used by the crop (green and blue) provides the components of
the water footprint inventory of the crop.