

Verifiable Water Use Inventory Using ICT …
29
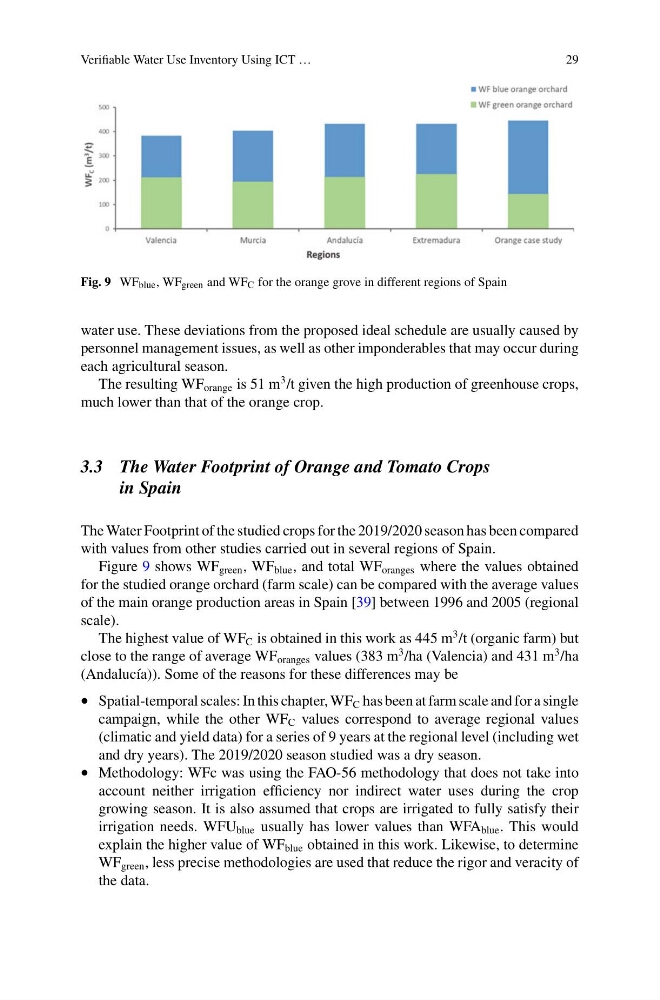
Fig. 9 WF blue , WF green and WF C for the orange grove in different regions of Spain
water use. These deviations from the proposed ideal schedule are usually caused by
personnel management issues, as well as other imponderables that may occur during
each agricultural season.
The resulting WF orange is 51 m
3 /t given the high production of greenhouse crops,
much lower than that of the orange crop.
3.3 The Water Footprint of Orange and Tomato Crops
in Spain
The Water Footprint of the studied crops for the 2019/2020 season has been compared
with values from other studies carried out in several regions of Spain.
Figure 9 shows WF green , WF blue , and total WF oranges where the values obtained
for the studied orange orchard (farm scale) can be compared with the average values
of the main orange production areas in Spain [39] between 1996 and 2005 (regional
scale).
The highest value of WF C is obtained in this work as 445 m
3 /t (organic farm) but
close to the range of average WF oranges values (383 m
3 /ha (Valencia) and 431 m
3 /ha
(Andalucía)). Some of the reasons for these differences may be
• Spatial-temporal scales: In this chapter, WF C has been at farm scale and for a single
campaign, while the other WF C values correspond to average regional values
(climatic and yield data) for a series of 9 years at the regional level (including wet
and dry years). The 2019/2020 season studied was a dry season.
• Methodology: WFc was using the FAO-56 methodology that does not take into
account neither irrigation efficiency nor indirect water uses during the crop
growing season. It is also assumed that crops are irrigated to fully satisfy their
irrigation needs. WFU blue usually has lower values than WFA blue . This would
explain the higher value of WF blue obtained in this work. Likewise, to determine
WF green , less precise methodologies are used that reduce the rigor and veracity of
the data.
29
Fig. 9 WF blue , WF green and WF C for the orange grove in different regions of Spain
water use. These deviations from the proposed ideal schedule are usually caused by
personnel management issues, as well as other imponderables that may occur during
each agricultural season.
The resulting WF orange is 51 m
3 /t given the high production of greenhouse crops,
much lower than that of the orange crop.
3.3 The Water Footprint of Orange and Tomato Crops
in Spain
The Water Footprint of the studied crops for the 2019/2020 season has been compared
with values from other studies carried out in several regions of Spain.
Figure 9 shows WF green , WF blue , and total WF oranges where the values obtained
for the studied orange orchard (farm scale) can be compared with the average values
of the main orange production areas in Spain [39] between 1996 and 2005 (regional
scale).
The highest value of WF C is obtained in this work as 445 m
3 /t (organic farm) but
close to the range of average WF oranges values (383 m
3 /ha (Valencia) and 431 m
3 /ha
(Andalucía)). Some of the reasons for these differences may be
• Spatial-temporal scales: In this chapter, WF C has been at farm scale and for a single
campaign, while the other WF C values correspond to average regional values
(climatic and yield data) for a series of 9 years at the regional level (including wet
and dry years). The 2019/2020 season studied was a dry season.
• Methodology: WFc was using the FAO-56 methodology that does not take into
account neither irrigation efficiency nor indirect water uses during the crop
growing season. It is also assumed that crops are irrigated to fully satisfy their
irrigation needs. WFU blue usually has lower values than WFA blue . This would
explain the higher value of WF blue obtained in this work. Likewise, to determine
WF green , less precise methodologies are used that reduce the rigor and veracity of
the data.