

Employing Input-Output Model to Assess …
181
W n *] is a row vector of all sector’s water intensities, which equals to direct water
inputs in each sector dividing the sector’s economic output.
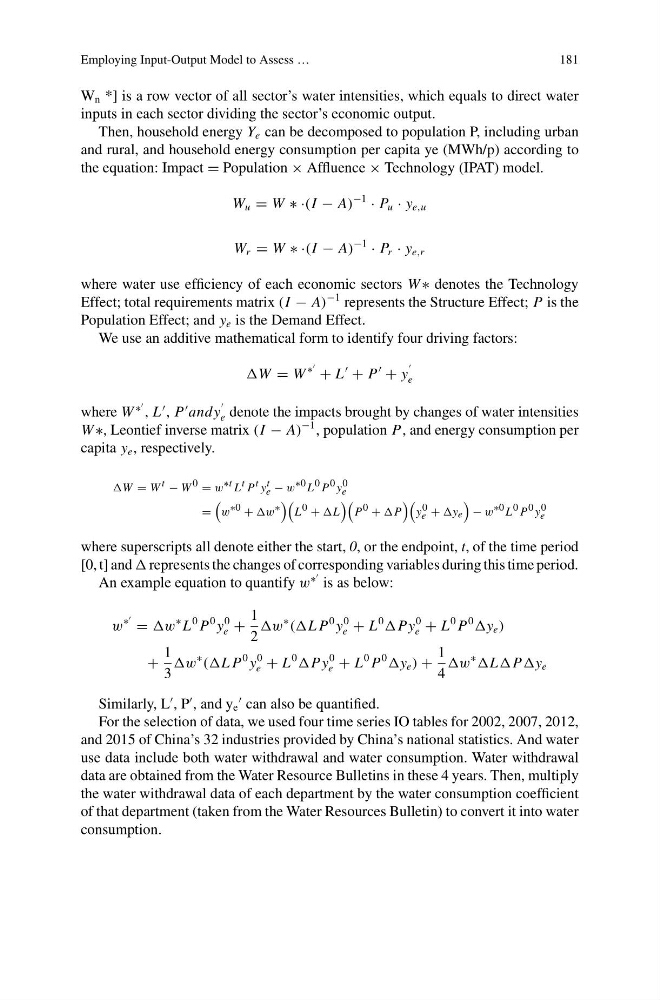
Then, household energy Y e can be decomposed to population P, including urban
and rural, and household energy consumption per capita ye (MWh/p) according to
the equation: Impact = Population × Affluence × Technology (IPAT) model.
W u = W ∗ ·(I − A)
−1
· P u · y e,u
W r = W ∗ ·(I − A)
−1
· P r · y e,r
where water use efficiency of each economic sectors W ∗ denotes the Technology
Effect; total requirements matrix (I − A)
−1 represents the Structure Effect; P is the
Population Effect; and y e is the Demand Effect.
We use an additive mathematical form to identify four driving factors:
W = W
∗
+ L
+ P
+ y
e
where W
∗
, L
, P
andy
e denote the impacts brought by changes of water intensities
W ∗, Leontief inverse matrix (I − A)
−1 , population P, and energy consumption per
capita y e , respectively.
W = W t − W 0 = w ∗t L t P t y t
e − w ∗0 L 0 P 0 y 0
e
=
w ∗0 + w ∗
L 0 + L
P 0 + P
y 0
e + y e
− w ∗0 L 0 P 0 y 0
e
where superscripts all denote either the start, 0, or the endpoint, t, of the time period
[0, t] and represents the changes of corresponding variables during this time period.
An example equation to quantify w
∗
is as below:
w
∗
= w
∗ L
0 P
0 y
0
e +
1
2
w
∗
((L P
0 y
0
e + L
0
Py
0
e + L
0 P
0
y e )
+
1
3
w
∗
((L P
0 y
0
e + L
0
Py
0
e + L
0 P
0
y e ) +
1
4
w
∗
LPy e
Similarly, L
, P
, and y e
can also be quantified.
For the selection of data, we used four time series IO tables for 2002, 2007, 2012,
and 2015 of China’s 32 industries provided by China’s national statistics. And water
use data include both water withdrawal and water consumption. Water withdrawal
data are obtained from the Water Resource Bulletins in these 4 years. Then, multiply
the water withdrawal data of each department by the water consumption coefficient
of that department (taken from the Water Resources Bulletin) to convert it into water
consumption.
181
W n *] is a row vector of all sector’s water intensities, which equals to direct water
inputs in each sector dividing the sector’s economic output.
Then, household energy Y e can be decomposed to population P, including urban
and rural, and household energy consumption per capita ye (MWh/p) according to
the equation: Impact = Population × Affluence × Technology (IPAT) model.
W u = W ∗ ·(I − A)
−1
· P u · y e,u
W r = W ∗ ·(I − A)
−1
· P r · y e,r
where water use efficiency of each economic sectors W ∗ denotes the Technology
Effect; total requirements matrix (I − A)
−1 represents the Structure Effect; P is the
Population Effect; and y e is the Demand Effect.
We use an additive mathematical form to identify four driving factors:
W = W
∗
+ L
+ P
+ y
e
where W
∗
, L
, P
andy
e denote the impacts brought by changes of water intensities
W ∗, Leontief inverse matrix (I − A)
−1 , population P, and energy consumption per
capita y e , respectively.
W = W t − W 0 = w ∗t L t P t y t
e − w ∗0 L 0 P 0 y 0
e
=
w ∗0 + w ∗
L 0 + L
P 0 + P
y 0
e + y e
− w ∗0 L 0 P 0 y 0
e
where superscripts all denote either the start, 0, or the endpoint, t, of the time period
[0, t] and represents the changes of corresponding variables during this time period.
An example equation to quantify w
∗
is as below:
w
∗
= w
∗ L
0 P
0 y
0
e +
1
2
w
∗
((L P
0 y
0
e + L
0
Py
0
e + L
0 P
0
y e )
+
1
3
w
∗
((L P
0 y
0
e + L
0
Py
0
e + L
0 P
0
y e ) +
1
4
w
∗
LPy e
Similarly, L
, P
, and y e
can also be quantified.
For the selection of data, we used four time series IO tables for 2002, 2007, 2012,
and 2015 of China’s 32 industries provided by China’s national statistics. And water
use data include both water withdrawal and water consumption. Water withdrawal
data are obtained from the Water Resource Bulletins in these 4 years. Then, multiply
the water withdrawal data of each department by the water consumption coefficient
of that department (taken from the Water Resources Bulletin) to convert it into water
consumption.