

178
L. Chai et al.
VP
PE
AN COD WD WC
0%
20%
40%
60%
80%
100%
Coal
Services & constructions
Equipments
Industrial supplies
Energy supply as power
Fuel supply as feedstocks
Direct use or discharge
VP
PE
AN COD WD WC
0%
20%
40%
60%
80%
100%
Crude oil
VP
PE
AN COD WD WC
0%
20%
40%
60%
80%
100%
Natural gas
VP
PE
AN COD WD WC
0%
20%
40%
60%
80%
100%
Coke
VP
PE
AN COD WD WC
0%
20%
40%
60%
80%
100%
Petroleum products
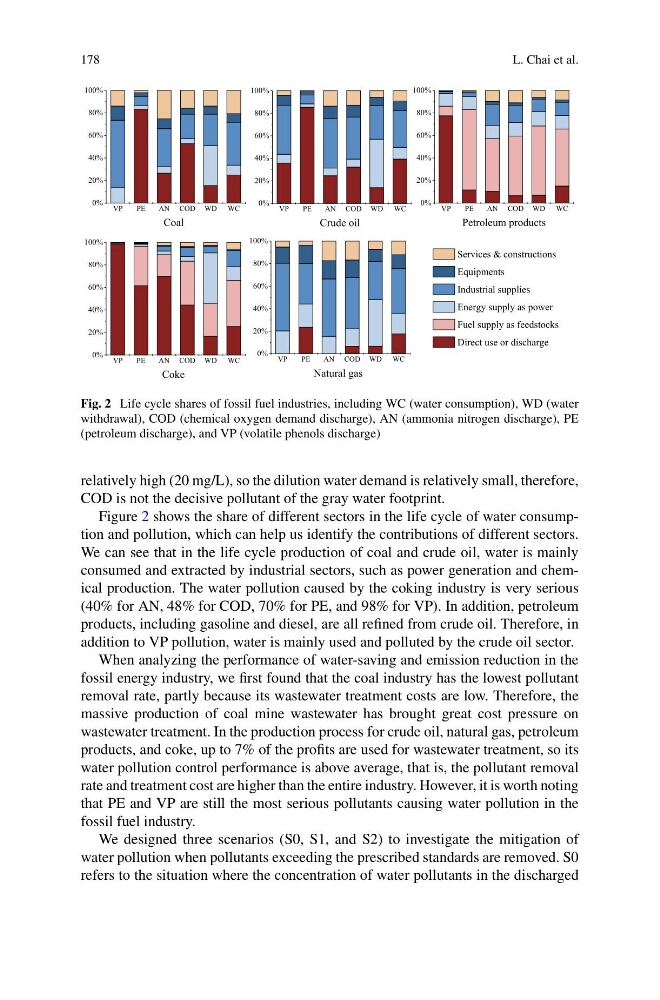
Fig. 2 Life cycle shares of fossil fuel industries, including WC (water consumption), WD (water
withdrawal), COD (chemical oxygen demand discharge), AN (ammonia nitrogen discharge), PE
(petroleum discharge), and VP (volatile phenols discharge)
relatively high (20 mg/L), so the dilution water demand is relatively small, therefore,
COD is not the decisive pollutant of the gray water footprint.
Figure 2 shows the share of different sectors in the life cycle of water consumption and pollution, which can help us identify the contributions of different sectors.
We can see that in the life cycle production of coal and crude oil, water is mainly
consumed and extracted by industrial sectors, such as power generation and chemical production. The water pollution caused by the coking industry is very serious
(40% for AN, 48% for COD, 70% for PE, and 98% for VP). In addition, petroleum
products, including gasoline and diesel, are all refined from crude oil. Therefore, in
addition to VP pollution, water is mainly used and polluted by the crude oil sector.
When analyzing the performance of water-saving and emission reduction in the
fossil energy industry, we first found that the coal industry has the lowest pollutant
removal rate, partly because its wastewater treatment costs are low. Therefore, the
massive production of coal mine wastewater has brought great cost pressure on
wastewater treatment. In the production process for crude oil, natural gas, petroleum
products, and coke, up to 7% of the profits are used for wastewater treatment, so its
water pollution control performance is above average, that is, the pollutant removal
rate and treatment cost are higher than the entire industry. However, it is worth noting
that PE and VP are still the most serious pollutants causing water pollution in the
fossil fuel industry.
We designed three scenarios (S0, S1, and S2) to investigate the mitigation of
water pollution when pollutants exceeding the prescribed standards are removed. S0
refers to the situation where the concentration of water pollutants in the discharged
L. Chai et al.
VP
PE
AN COD WD WC
0%
20%
40%
60%
80%
100%
Coal
Services & constructions
Equipments
Industrial supplies
Energy supply as power
Fuel supply as feedstocks
Direct use or discharge
VP
PE
AN COD WD WC
0%
20%
40%
60%
80%
100%
Crude oil
VP
PE
AN COD WD WC
0%
20%
40%
60%
80%
100%
Natural gas
VP
PE
AN COD WD WC
0%
20%
40%
60%
80%
100%
Coke
VP
PE
AN COD WD WC
0%
20%
40%
60%
80%
100%
Petroleum products
Fig. 2 Life cycle shares of fossil fuel industries, including WC (water consumption), WD (water
withdrawal), COD (chemical oxygen demand discharge), AN (ammonia nitrogen discharge), PE
(petroleum discharge), and VP (volatile phenols discharge)
relatively high (20 mg/L), so the dilution water demand is relatively small, therefore,
COD is not the decisive pollutant of the gray water footprint.
Figure 2 shows the share of different sectors in the life cycle of water consumption and pollution, which can help us identify the contributions of different sectors.
We can see that in the life cycle production of coal and crude oil, water is mainly
consumed and extracted by industrial sectors, such as power generation and chemical production. The water pollution caused by the coking industry is very serious
(40% for AN, 48% for COD, 70% for PE, and 98% for VP). In addition, petroleum
products, including gasoline and diesel, are all refined from crude oil. Therefore, in
addition to VP pollution, water is mainly used and polluted by the crude oil sector.
When analyzing the performance of water-saving and emission reduction in the
fossil energy industry, we first found that the coal industry has the lowest pollutant
removal rate, partly because its wastewater treatment costs are low. Therefore, the
massive production of coal mine wastewater has brought great cost pressure on
wastewater treatment. In the production process for crude oil, natural gas, petroleum
products, and coke, up to 7% of the profits are used for wastewater treatment, so its
water pollution control performance is above average, that is, the pollutant removal
rate and treatment cost are higher than the entire industry. However, it is worth noting
that PE and VP are still the most serious pollutants causing water pollution in the
fossil fuel industry.
We designed three scenarios (S0, S1, and S2) to investigate the mitigation of
water pollution when pollutants exceeding the prescribed standards are removed. S0
refers to the situation where the concentration of water pollutants in the discharged