

94
M. D. Alba-Rodríguez et al.
Table 10 Annual direct
water footprints with
distribution by type of water
Scenarios
S1
S2
S3
WF d blue (m 3 )
82.18
648.49
771.58
WF d green (m 3 )
0.00
531.07
583.87
WF d grey (m 3 )
1.561.39
635.84
596.72
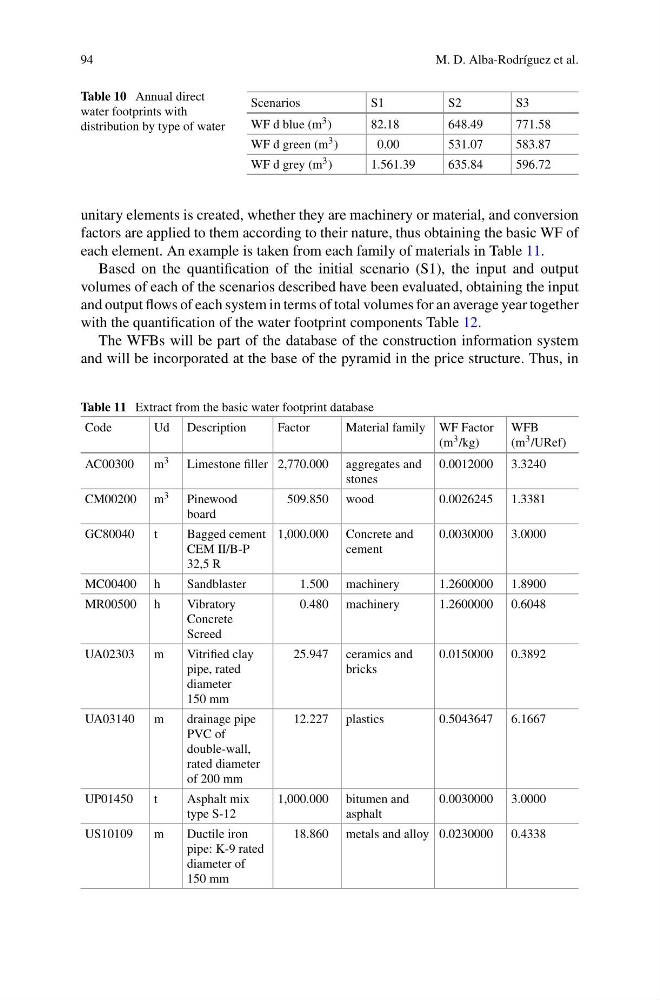
unitary elements is created, whether they are machinery or material, and conversion
factors are applied to them according to their nature, thus obtaining the basic WF of
each element. An example is taken from each family of materials in Table 11.
Based on the quantification of the initial scenario (S1), the input and output
volumes of each of the scenarios described have been evaluated, obtaining the input
and output flows of each system in terms of total volumes for an average year together
with the quantification of the water footprint components Table 12.
The WFBs will be part of the database of the construction information system
and will be incorporated at the base of the pyramid in the price structure. Thus, in
Table 11 Extract from the basic water footprint database
Code
Ud Description
Factor
Material family WF Factor
(m 3 /kg)
WFB
(m 3 /URef)
AC00300
m 3 Limestone filler 2,770.000 aggregates and
stones
0.0012000 3.3240
CM00200 m 3 Pinewood
board
509.850 wood
0.0026245 1.3381
GC80040
t
Bagged cement
CEM II/B-P
32,5 R
1,000.000 Concrete and
cement
0.0030000 3.0000
MC00400 h
Sandblaster
1.500 machinery
1.2600000 1.8900
MR00500 h
Vibratory
Concrete
Screed
0.480 machinery
1.2600000 0.6048
UA02303
m
Vitrified clay
pipe, rated
diameter
150 mm
25.947 ceramics and
bricks
0.0150000 0.3892
UA03140
m
drainage pipe
PVC of
double-wall,
rated diameter
of 200 mm
12.227 plastics
0.5043647 6.1667
UP01450
t
Asphalt mix
type S-12
1,000.000 bitumen and
asphalt
0.0030000 3.0000
US10109
m
Ductile iron
pipe: K-9 rated
diameter of
150 mm
18.860 metals and alloy 0.0230000 0.4338
M. D. Alba-Rodríguez et al.
Table 10 Annual direct
water footprints with
distribution by type of water
Scenarios
S1
S2
S3
WF d blue (m 3 )
82.18
648.49
771.58
WF d green (m 3 )
0.00
531.07
583.87
WF d grey (m 3 )
1.561.39
635.84
596.72
unitary elements is created, whether they are machinery or material, and conversion
factors are applied to them according to their nature, thus obtaining the basic WF of
each element. An example is taken from each family of materials in Table 11.
Based on the quantification of the initial scenario (S1), the input and output
volumes of each of the scenarios described have been evaluated, obtaining the input
and output flows of each system in terms of total volumes for an average year together
with the quantification of the water footprint components Table 12.
The WFBs will be part of the database of the construction information system
and will be incorporated at the base of the pyramid in the price structure. Thus, in
Table 11 Extract from the basic water footprint database
Code
Ud Description
Factor
Material family WF Factor
(m 3 /kg)
WFB
(m 3 /URef)
AC00300
m 3 Limestone filler 2,770.000 aggregates and
stones
0.0012000 3.3240
CM00200 m 3 Pinewood
board
509.850 wood
0.0026245 1.3381
GC80040
t
Bagged cement
CEM II/B-P
32,5 R
1,000.000 Concrete and
cement
0.0030000 3.0000
MC00400 h
Sandblaster
1.500 machinery
1.2600000 1.8900
MR00500 h
Vibratory
Concrete
Screed
0.480 machinery
1.2600000 0.6048
UA02303
m
Vitrified clay
pipe, rated
diameter
150 mm
25.947 ceramics and
bricks
0.0150000 0.3892
UA03140
m
drainage pipe
PVC of
double-wall,
rated diameter
of 200 mm
12.227 plastics
0.5043647 6.1667
UP01450
t
Asphalt mix
type S-12
1,000.000 bitumen and
asphalt
0.0030000 3.0000
US10109
m
Ductile iron
pipe: K-9 rated
diameter of
150 mm
18.860 metals and alloy 0.0230000 0.4338