

113
Anatomy
In sequential sampling, the stimulus is detected by a single receptor as the cell changes its position
in relation to the light source. In this situation, the organism measures directly a temporal gradient and
then infers the spatial gradient from the information on the movements of the receptor (two-instant
mechanism). This strategy is present in all the algae with a single photoreceptor. These algae have only
a limited vision of the 3D world in which they navigate and cannot detect light directions by measuring light intensity at two different positions in the cell body. An example is Leptolyngbya sp., whose
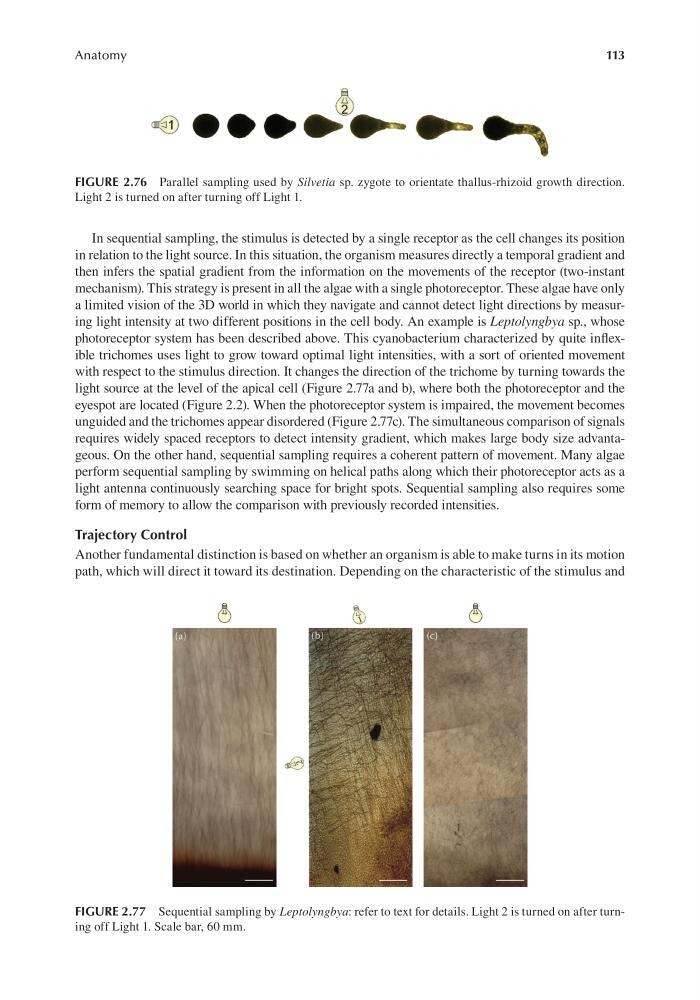
photoreceptor system has been described above. This cyanobacterium characterized by quite inflexible trichomes uses light to grow toward optimal light intensities, with a sort of oriented movement
with respect to the stimulus direction. It changes the direction of the trichome by turning towards the
light source at the level of the apical cell (Figure 2.77a and b), where both the photoreceptor and the
eyespot are located (Figure 2.2). When the photoreceptor system is impaired, the movement becomes
unguided and the trichomes appear disordered (Figure 2.77c). The simultaneous comparison of signals
requires widely spaced receptors to detect intensity gradient, which makes large body size advantageous. On the other hand, sequential sampling requires a coherent pattern of movement. Many algae
perform sequential sampling by swimming on helical paths along which their photoreceptor acts as a
light antenna continuously searching space for bright spots. Sequential sampling also requires some
form of memory to allow the comparison with previously recorded intensities.
Trajectory Control
Another fundamental distinction is based on whether an organism is able to make turns in its motion
path, which will direct it toward its destination. Depending on the characteristic of the stimulus and
FIGURE 2.76 Parallel sampling used by Silvetia sp. zygote to orientate thallus-rhizoid growth direction.
Light 2 is turned on after turning off Light 1.
FIGURE 2.77 Sequential sampling by Leptolyngbya: refer to text for details. Light 2 is turned on after turning off Light 1. Scale bar, 60 mm.
Anatomy
In sequential sampling, the stimulus is detected by a single receptor as the cell changes its position
in relation to the light source. In this situation, the organism measures directly a temporal gradient and
then infers the spatial gradient from the information on the movements of the receptor (two-instant
mechanism). This strategy is present in all the algae with a single photoreceptor. These algae have only
a limited vision of the 3D world in which they navigate and cannot detect light directions by measuring light intensity at two different positions in the cell body. An example is Leptolyngbya sp., whose
photoreceptor system has been described above. This cyanobacterium characterized by quite inflexible trichomes uses light to grow toward optimal light intensities, with a sort of oriented movement
with respect to the stimulus direction. It changes the direction of the trichome by turning towards the
light source at the level of the apical cell (Figure 2.77a and b), where both the photoreceptor and the
eyespot are located (Figure 2.2). When the photoreceptor system is impaired, the movement becomes
unguided and the trichomes appear disordered (Figure 2.77c). The simultaneous comparison of signals
requires widely spaced receptors to detect intensity gradient, which makes large body size advantageous. On the other hand, sequential sampling requires a coherent pattern of movement. Many algae
perform sequential sampling by swimming on helical paths along which their photoreceptor acts as a
light antenna continuously searching space for bright spots. Sequential sampling also requires some
form of memory to allow the comparison with previously recorded intensities.
Trajectory Control
Another fundamental distinction is based on whether an organism is able to make turns in its motion
path, which will direct it toward its destination. Depending on the characteristic of the stimulus and
FIGURE 2.76 Parallel sampling used by Silvetia sp. zygote to orientate thallus-rhizoid growth direction.
Light 2 is turned on after turning off Light 1.
FIGURE 2.77 Sequential sampling by Leptolyngbya: refer to text for details. Light 2 is turned on after turning off Light 1. Scale bar, 60 mm.