

China, thereby reducing air pollutants, improving economic efficiency, and promoting industrial development and economic growth in Japan.
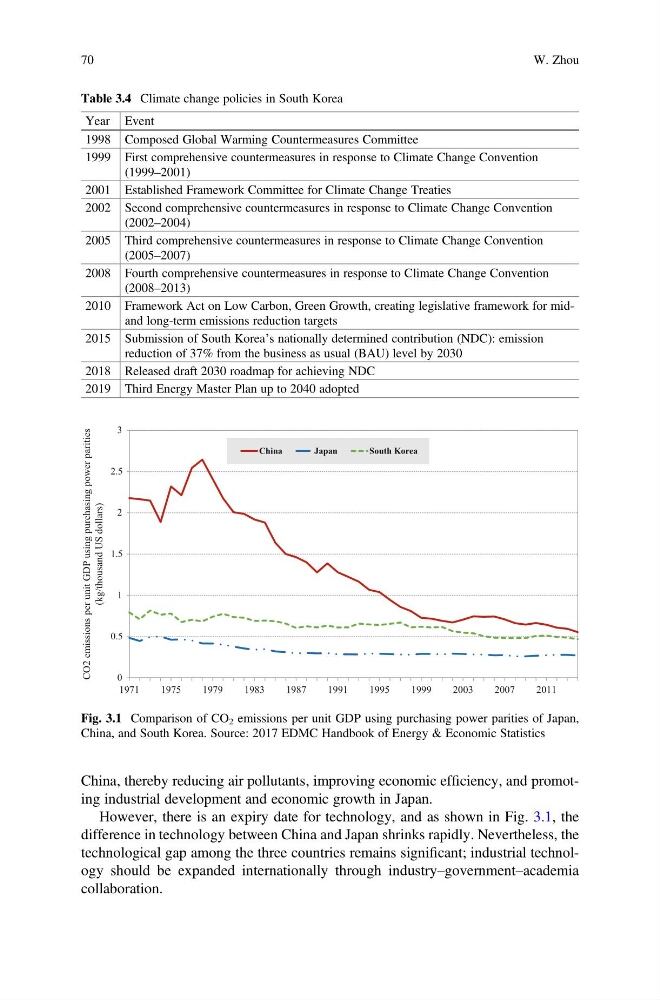
However, there is an expiry date for technology, and as shown in Fig. 3.1, the
difference in technology between China and Japan shrinks rapidly. Nevertheless, the
technological gap among the three countries remains significant; industrial technology should be expanded internationally through industry–government–academia
collaboration.
Table 3.4 Climate change policies in South Korea
Year Event
1998 Composed Global Warming Countermeasures Committee
1999 First comprehensive countermeasures in response to Climate Change Convention
(1999–2001)
2001 Established Framework Committee for Climate Change Treaties
2002 Second comprehensive countermeasures in response to Climate Change Convention
(2002–2004)
2005 Third comprehensive countermeasures in response to Climate Change Convention
(2005–2007)
2008 Fourth comprehensive countermeasures in response to Climate Change Convention
(2008–2013)
2010 Framework Act on Low Carbon, Green Growth, creating legislative framework for midand long-term emissions reduction targets
2015 Submission of South Korea’s nationally determined contribution (NDC): emission
reduction of 37% from the business as usual (BAU) level by 2030
2018 Released draft 2030 roadmap for achieving NDC
2019 Third Energy Master Plan up to 2040 adopted
0
0.5
1
1.5
2
2.5
3
1971
1975
1979
1983
1987
1991
1995
1999
2003
2007
2011
China
Japan
South Korea
s
e
i
t
i
r
a
p
r
e
w
o
p
g
n
i
s
a
h
c
r
u
p
g
n
i
s
u
P
D
G
t
i
n
u
r
e
p
s
n
o
i
s
s
i
m
e
2
O
C
)
s
r
a
l
l
o
d
S
U
d
n
a
s
u
o
h
t
/
g
k
(
Fig. 3.1 Comparison of CO 2 emissions per unit GDP using purchasing power parities of Japan,
China, and South Korea. Source: 2017 EDMC Handbook of Energy & Economic Statistics
70
W. Zhou
However, there is an expiry date for technology, and as shown in Fig. 3.1, the
difference in technology between China and Japan shrinks rapidly. Nevertheless, the
technological gap among the three countries remains significant; industrial technology should be expanded internationally through industry–government–academia
collaboration.
Table 3.4 Climate change policies in South Korea
Year Event
1998 Composed Global Warming Countermeasures Committee
1999 First comprehensive countermeasures in response to Climate Change Convention
(1999–2001)
2001 Established Framework Committee for Climate Change Treaties
2002 Second comprehensive countermeasures in response to Climate Change Convention
(2002–2004)
2005 Third comprehensive countermeasures in response to Climate Change Convention
(2005–2007)
2008 Fourth comprehensive countermeasures in response to Climate Change Convention
(2008–2013)
2010 Framework Act on Low Carbon, Green Growth, creating legislative framework for midand long-term emissions reduction targets
2015 Submission of South Korea’s nationally determined contribution (NDC): emission
reduction of 37% from the business as usual (BAU) level by 2030
2018 Released draft 2030 roadmap for achieving NDC
2019 Third Energy Master Plan up to 2040 adopted
0
0.5
1
1.5
2
2.5
3
1971
1975
1979
1983
1987
1991
1995
1999
2003
2007
2011
China
Japan
South Korea
s
e
i
t
i
r
a
p
r
e
w
o
p
g
n
i
s
a
h
c
r
u
p
g
n
i
s
u
P
D
G
t
i
n
u
r
e
p
s
n
o
i
s
s
i
m
e
2
O
C
)
s
r
a
l
l
o
d
S
U
d
n
a
s
u
o
h
t
/
g
k
(
Fig. 3.1 Comparison of CO 2 emissions per unit GDP using purchasing power parities of Japan,
China, and South Korea. Source: 2017 EDMC Handbook of Energy & Economic Statistics
70
W. Zhou