

21.2.2 Resolving the Mismatch Problem in Germany
Figure 21.7 shows electricity consumption in Germany. North Rhine-Westphalia
consumes the most electricity, followed by Bayern and Baden-Württemberg in the
south and Lower Saxony (Niedersachsen) in the northwest.
In Japan, solar power generation facilities of 10 kW or more are the most
commonly certified renewable energy and tend to be concentrated in areas with
low power consumption. In contrast, in Germany, the introduction of renewable
energy is largest in regions with high power consumption. Only wind power is
installed foremost in areas with low power demand. The power generated by other
renewable energies roughly matches regional power demands.
The fact that Germany, unlike Japan, was not exposed to a serious mismatch in
supply and demand is related to its natural resource endowment. For example, in
Germany, as in Japan, the introduction of photovoltaic power generation was mainly
concentrated in areas with high solar radiation. However, southern Germany, where
solar radiation is high, is a densely populated industrial area with high electricity
demand. Thus, the introduction of large amounts of solar power in the southern
region is rather appropriate.
Perhaps more important than the natural conditions is the stance of the German
government in strongly promoting renewable energy. Japan did not announce a
specific target for renewable energy introduction until 2015, whereas this was
legislated in Germany in 2009. Following several revisions, the target announced
in EEG 2014 is an extremely high target of 40–45% renewable energy power by
2025 and 55–60% by 2035. To achieve these goals, the German government has put
a lot of effort into strengthening the transmission system. In 2009, the Transmission
Line Expansion Plan (EnLAG) detailed 24 transmission line projects (covering a
total of 1876 km; in the latest amendment, the final project was replaced by
another plan).
7,397
6,410
5,309
4,990
4,059
3,303
2,984
0
1,000
2,000
3,000
4,000
5,000
6,000
7,000
8,000
(2012/7 ~ 2012
/9)*4
(2012/7 ~2012/12
)*4/2
(2012/7 ~2013/3)
*4/3
2012/7 ~ 2013/6 2012/10~2013/9 2013 /1~ 2013/12 2013/4 ~ 2014/3
MW
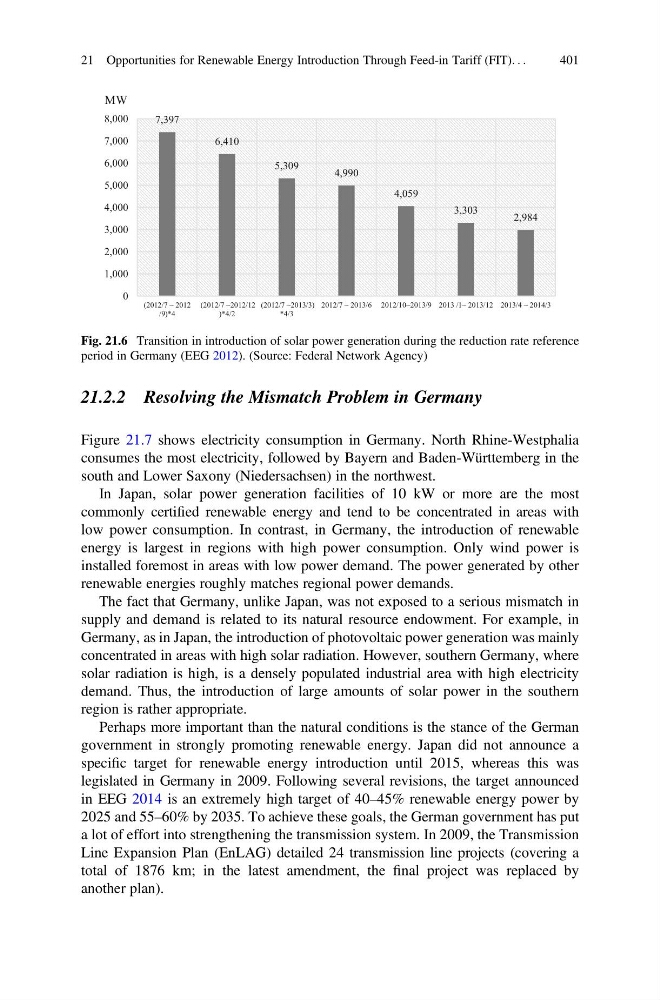
Fig. 21.6 Transition in introduction of solar power generation during the reduction rate reference
period in Germany (EEG 2012). (Source: Federal Network Agency)
21 Opportunities for Renewable Energy Introduction Through Feed-in Tariff (FIT). . .
401
Figure 21.7 shows electricity consumption in Germany. North Rhine-Westphalia
consumes the most electricity, followed by Bayern and Baden-Württemberg in the
south and Lower Saxony (Niedersachsen) in the northwest.
In Japan, solar power generation facilities of 10 kW or more are the most
commonly certified renewable energy and tend to be concentrated in areas with
low power consumption. In contrast, in Germany, the introduction of renewable
energy is largest in regions with high power consumption. Only wind power is
installed foremost in areas with low power demand. The power generated by other
renewable energies roughly matches regional power demands.
The fact that Germany, unlike Japan, was not exposed to a serious mismatch in
supply and demand is related to its natural resource endowment. For example, in
Germany, as in Japan, the introduction of photovoltaic power generation was mainly
concentrated in areas with high solar radiation. However, southern Germany, where
solar radiation is high, is a densely populated industrial area with high electricity
demand. Thus, the introduction of large amounts of solar power in the southern
region is rather appropriate.
Perhaps more important than the natural conditions is the stance of the German
government in strongly promoting renewable energy. Japan did not announce a
specific target for renewable energy introduction until 2015, whereas this was
legislated in Germany in 2009. Following several revisions, the target announced
in EEG 2014 is an extremely high target of 40–45% renewable energy power by
2025 and 55–60% by 2035. To achieve these goals, the German government has put
a lot of effort into strengthening the transmission system. In 2009, the Transmission
Line Expansion Plan (EnLAG) detailed 24 transmission line projects (covering a
total of 1876 km; in the latest amendment, the final project was replaced by
another plan).
7,397
6,410
5,309
4,990
4,059
3,303
2,984
0
1,000
2,000
3,000
4,000
5,000
6,000
7,000
8,000
(2012/7 ~ 2012
/9)*4
(2012/7 ~2012/12
)*4/2
(2012/7 ~2013/3)
*4/3
2012/7 ~ 2013/6 2012/10~2013/9 2013 /1~ 2013/12 2013/4 ~ 2014/3
MW
Fig. 21.6 Transition in introduction of solar power generation during the reduction rate reference
period in Germany (EEG 2012). (Source: Federal Network Agency)
21 Opportunities for Renewable Energy Introduction Through Feed-in Tariff (FIT). . .
401