

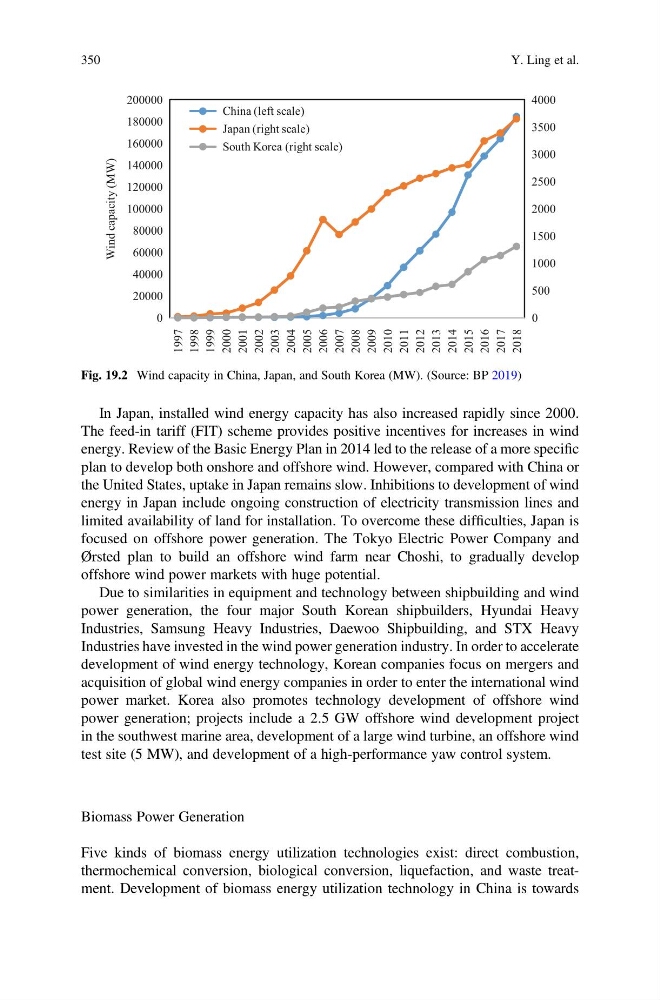
In Japan, installed wind energy capacity has also increased rapidly since 2000.
The feed-in tariff (FIT) scheme provides positive incentives for increases in wind
energy. Review of the Basic Energy Plan in 2014 led to the release of a more specific
plan to develop both onshore and offshore wind. However, compared with China or
the United States, uptake in Japan remains slow. Inhibitions to development of wind
energy in Japan include ongoing construction of electricity transmission lines and
limited availability of land for installation. To overcome these difficulties, Japan is
focused on offshore power generation. The Tokyo Electric Power Company and
Ørsted plan to build an offshore wind farm near Choshi, to gradually develop
offshore wind power markets with huge potential.
Due to similarities in equipment and technology between shipbuilding and wind
power generation, the four major South Korean shipbuilders, Hyundai Heavy
Industries, Samsung Heavy Industries, Daewoo Shipbuilding, and STX Heavy
Industries have invested in the wind power generation industry. In order to accelerate
development of wind energy technology, Korean companies focus on mergers and
acquisition of global wind energy companies in order to enter the international wind
power market. Korea also promotes technology development of offshore wind
power generation; projects include a 2.5 GW offshore wind development project
in the southwest marine area, development of a large wind turbine, an offshore wind
test site (5 MW), and development of a high-performance yaw control system.
Biomass Power Generation
Five kinds of biomass energy utilization technologies exist: direct combustion,
thermochemical conversion, biological conversion, liquefaction, and waste treatment. Development of biomass energy utilization technology in China is towards
0
500
1000
1500
2000
2500
3000
3500
4000
0
20000
40000
60000
80000
100000
120000
140000
160000
180000
200000
1997
1998
1999
2000
2001
2002
2003
2004
2005
2006
2007
2008
2009
2010
2011
2012
2013
2014
2015
2016
2017
2018
Wind capacity (MW)
China (left scale)
Japan (right scale)
South Korea (right scale)
Fig. 19.2 Wind capacity in China, Japan, and South Korea (MW). (Source: BP 2019)
350
Y. Ling et al.
The feed-in tariff (FIT) scheme provides positive incentives for increases in wind
energy. Review of the Basic Energy Plan in 2014 led to the release of a more specific
plan to develop both onshore and offshore wind. However, compared with China or
the United States, uptake in Japan remains slow. Inhibitions to development of wind
energy in Japan include ongoing construction of electricity transmission lines and
limited availability of land for installation. To overcome these difficulties, Japan is
focused on offshore power generation. The Tokyo Electric Power Company and
Ørsted plan to build an offshore wind farm near Choshi, to gradually develop
offshore wind power markets with huge potential.
Due to similarities in equipment and technology between shipbuilding and wind
power generation, the four major South Korean shipbuilders, Hyundai Heavy
Industries, Samsung Heavy Industries, Daewoo Shipbuilding, and STX Heavy
Industries have invested in the wind power generation industry. In order to accelerate
development of wind energy technology, Korean companies focus on mergers and
acquisition of global wind energy companies in order to enter the international wind
power market. Korea also promotes technology development of offshore wind
power generation; projects include a 2.5 GW offshore wind development project
in the southwest marine area, development of a large wind turbine, an offshore wind
test site (5 MW), and development of a high-performance yaw control system.
Biomass Power Generation
Five kinds of biomass energy utilization technologies exist: direct combustion,
thermochemical conversion, biological conversion, liquefaction, and waste treatment. Development of biomass energy utilization technology in China is towards
0
500
1000
1500
2000
2500
3000
3500
4000
0
20000
40000
60000
80000
100000
120000
140000
160000
180000
200000
1997
1998
1999
2000
2001
2002
2003
2004
2005
2006
2007
2008
2009
2010
2011
2012
2013
2014
2015
2016
2017
2018
Wind capacity (MW)
China (left scale)
Japan (right scale)
South Korea (right scale)
Fig. 19.2 Wind capacity in China, Japan, and South Korea (MW). (Source: BP 2019)
350
Y. Ling et al.