

Y ¼ C Á I À A
ð
Þ
À1 Á F consumption‐based
ð
Þ
ð 16:2Þ
where, Y is the estimated matrix of CO 2 emissions; X is the matrix of CO 2 emitted;
C is a diagonal matrix containing the CO 2 emission coefficient in each area; I is a
unit matrix; A is an input coefficient matrix consisting of 7 areas and 35 industries;
and F is the final demand vector in each region.
16.4 Quantitative Analysis of Induced Regional CO 2
Emissions
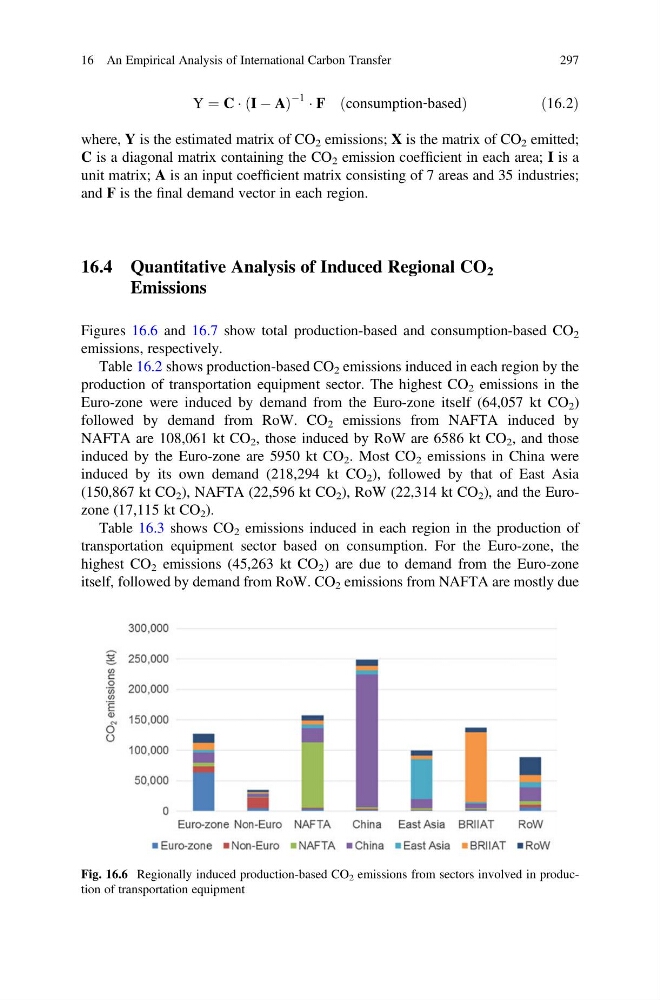
Figures 16.6 and 16.7 show total production-based and consumption-based CO 2
emissions, respectively.
Table 16.2 shows production-based CO 2 emissions induced in each region by the
production of transportation equipment sector. The highest CO 2 emissions in the
Euro-zone were induced by demand from the Euro-zone itself (64,057 kt CO 2 )
followed by demand from RoW. CO 2 emissions from NAFTA induced by
NAFTA are 108,061 kt CO 2 , those induced by RoW are 6586 kt CO 2 , and those
induced by the Euro-zone are 5950 kt CO 2 . Most CO 2 emissions in China were
induced by its own demand (218,294 kt CO 2 ), followed by that of East Asia
(150,867 kt CO 2 ), NAFTA (22,596 kt CO 2 ), RoW (22,314 kt CO 2 ), and the Eurozone (17,115 kt CO 2 ).
Table 16.3 shows CO 2 emissions induced in each region in the production of
transportation equipment sector based on consumption. For the Euro-zone, the
highest CO 2 emissions (45,263 kt CO 2 ) are due to demand from the Euro-zone
itself, followed by demand from RoW. CO 2 emissions from NAFTA are mostly due
Fig. 16.6 Regionally induced production-based CO 2 emissions from sectors involved in production of transportation equipment
16 An Empirical Analysis of International Carbon Transfer
297
ð
Þ
À1 Á F consumption‐based
ð
Þ
ð 16:2Þ
where, Y is the estimated matrix of CO 2 emissions; X is the matrix of CO 2 emitted;
C is a diagonal matrix containing the CO 2 emission coefficient in each area; I is a
unit matrix; A is an input coefficient matrix consisting of 7 areas and 35 industries;
and F is the final demand vector in each region.
16.4 Quantitative Analysis of Induced Regional CO 2
Emissions
Figures 16.6 and 16.7 show total production-based and consumption-based CO 2
emissions, respectively.
Table 16.2 shows production-based CO 2 emissions induced in each region by the
production of transportation equipment sector. The highest CO 2 emissions in the
Euro-zone were induced by demand from the Euro-zone itself (64,057 kt CO 2 )
followed by demand from RoW. CO 2 emissions from NAFTA induced by
NAFTA are 108,061 kt CO 2 , those induced by RoW are 6586 kt CO 2 , and those
induced by the Euro-zone are 5950 kt CO 2 . Most CO 2 emissions in China were
induced by its own demand (218,294 kt CO 2 ), followed by that of East Asia
(150,867 kt CO 2 ), NAFTA (22,596 kt CO 2 ), RoW (22,314 kt CO 2 ), and the Eurozone (17,115 kt CO 2 ).
Table 16.3 shows CO 2 emissions induced in each region in the production of
transportation equipment sector based on consumption. For the Euro-zone, the
highest CO 2 emissions (45,263 kt CO 2 ) are due to demand from the Euro-zone
itself, followed by demand from RoW. CO 2 emissions from NAFTA are mostly due
Fig. 16.6 Regionally induced production-based CO 2 emissions from sectors involved in production of transportation equipment
16 An Empirical Analysis of International Carbon Transfer
297