

14.2 Methodology
We assume the same BAU scenario as in Chap. 4; the balanced SSP2 scenario
(O’Neill et al. 2014; Fricko et al. 2016) is used to represent future socioeconomic
projection. We considered the emission reduction scenario (TAR) and an emissions
trading scenario (TRD) as described above. The G-CEEP model (Su et al. 2010,
2012a, b) was used to optimize results. In addition, we distinguished the effects and
costs of various abatement options.
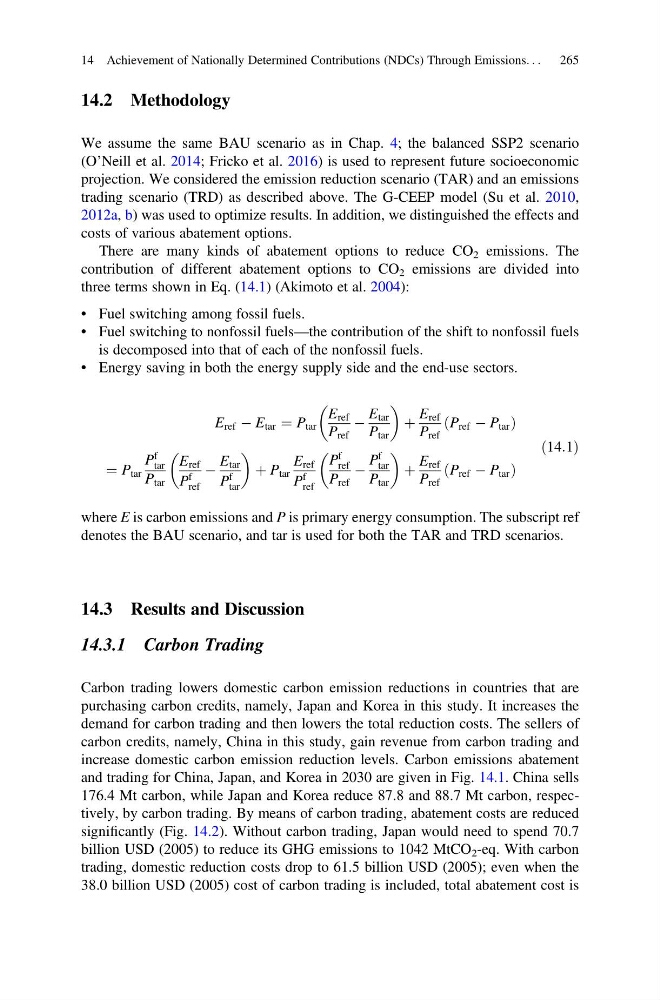
There are many kinds of abatement options to reduce CO 2 emissions. The
contribution of different abatement options to CO 2 emissions are divided into
three terms shown in Eq. (14.1) (Akimoto et al. 2004):
• Fuel switching among fossil fuels.
• Fuel switching to nonfossil fuels—the contribution of the shift to nonfossil fuels
is decomposed into that of each of the nonfossil fuels.
• Energy saving in both the energy supply side and the end-use sectors.
E ref À E tar ¼ P tar
E ref
P ref
À
E tar
P tar
þ
E ref
P ref
P ref À P tar
ð
Þ
¼ P tar
P
f
tar
P tar
E ref
P
f
ref
À
E tar
P
f
tar
þ P tar
E ref
P
f
ref
P
f
ref
P ref
À
P
f
tar
P tar
þ
E ref
P ref
P ref À P tar
ð
Þ
ð14:1Þ
where E is carbon emissions and P is primary energy consumption. The subscript ref
denotes the BAU scenario, and tar is used for both the TAR and TRD scenarios.
14.3 Results and Discussion
14.3.1 Carbon Trading
Carbon trading lowers domestic carbon emission reductions in countries that are
purchasing carbon credits, namely, Japan and Korea in this study. It increases the
demand for carbon trading and then lowers the total reduction costs. The sellers of
carbon credits, namely, China in this study, gain revenue from carbon trading and
increase domestic carbon emission reduction levels. Carbon emissions abatement
and trading for China, Japan, and Korea in 2030 are given in Fig. 14.1. China sells
176.4 Mt carbon, while Japan and Korea reduce 87.8 and 88.7 Mt carbon, respectively, by carbon trading. By means of carbon trading, abatement costs are reduced
significantly (Fig. 14.2). Without carbon trading, Japan would need to spend 70.7
billion USD (2005) to reduce its GHG emissions to 1042 MtCO 2 -eq. With carbon
trading, domestic reduction costs drop to 61.5 billion USD (2005); even when the
38.0 billion USD (2005) cost of carbon trading is included, total abatement cost is
14 Achievement of Nationally Determined Contributions (NDCs) Through Emissions. . .
265
We assume the same BAU scenario as in Chap. 4; the balanced SSP2 scenario
(O’Neill et al. 2014; Fricko et al. 2016) is used to represent future socioeconomic
projection. We considered the emission reduction scenario (TAR) and an emissions
trading scenario (TRD) as described above. The G-CEEP model (Su et al. 2010,
2012a, b) was used to optimize results. In addition, we distinguished the effects and
costs of various abatement options.
There are many kinds of abatement options to reduce CO 2 emissions. The
contribution of different abatement options to CO 2 emissions are divided into
three terms shown in Eq. (14.1) (Akimoto et al. 2004):
• Fuel switching among fossil fuels.
• Fuel switching to nonfossil fuels—the contribution of the shift to nonfossil fuels
is decomposed into that of each of the nonfossil fuels.
• Energy saving in both the energy supply side and the end-use sectors.
E ref À E tar ¼ P tar
E ref
P ref
À
E tar
P tar
þ
E ref
P ref
P ref À P tar
ð
Þ
¼ P tar
P
f
tar
P tar
E ref
P
f
ref
À
E tar
P
f
tar
þ P tar
E ref
P
f
ref
P
f
ref
P ref
À
P
f
tar
P tar
þ
E ref
P ref
P ref À P tar
ð
Þ
ð14:1Þ
where E is carbon emissions and P is primary energy consumption. The subscript ref
denotes the BAU scenario, and tar is used for both the TAR and TRD scenarios.
14.3 Results and Discussion
14.3.1 Carbon Trading
Carbon trading lowers domestic carbon emission reductions in countries that are
purchasing carbon credits, namely, Japan and Korea in this study. It increases the
demand for carbon trading and then lowers the total reduction costs. The sellers of
carbon credits, namely, China in this study, gain revenue from carbon trading and
increase domestic carbon emission reduction levels. Carbon emissions abatement
and trading for China, Japan, and Korea in 2030 are given in Fig. 14.1. China sells
176.4 Mt carbon, while Japan and Korea reduce 87.8 and 88.7 Mt carbon, respectively, by carbon trading. By means of carbon trading, abatement costs are reduced
significantly (Fig. 14.2). Without carbon trading, Japan would need to spend 70.7
billion USD (2005) to reduce its GHG emissions to 1042 MtCO 2 -eq. With carbon
trading, domestic reduction costs drop to 61.5 billion USD (2005); even when the
38.0 billion USD (2005) cost of carbon trading is included, total abatement cost is
14 Achievement of Nationally Determined Contributions (NDCs) Through Emissions. . .
265