

(a) shows static pressure and (b) the pressure coefficient. As seen in both diagrams,
the pressure of the water flow tends to give a higher value around the edge, directly
facing the blades of the water mill. Water tends to flow along the inner surface of the
pipe, whereas the core portion inside the pipe is occupied almost entirely by air. This
allows high levels of energy to be harnessed from drainage water with high
efficiency.
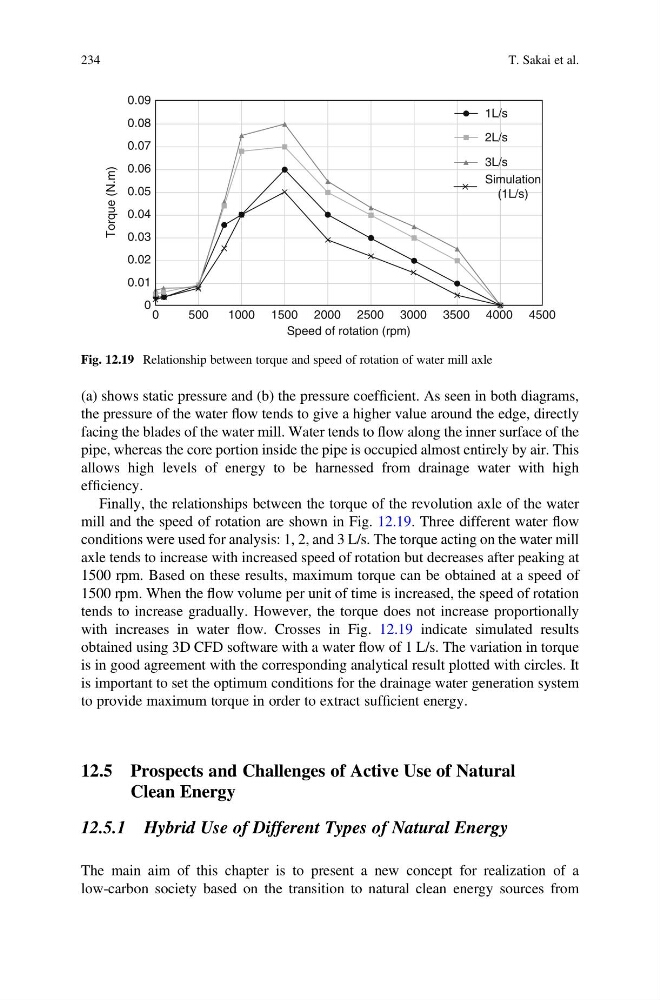
Finally, the relationships between the torque of the revolution axle of the water
mill and the speed of rotation are shown in Fig. 12.19. Three different water flow
conditions were used for analysis: 1, 2, and 3 L/s. The torque acting on the water mill
axle tends to increase with increased speed of rotation but decreases after peaking at
1500 rpm. Based on these results, maximum torque can be obtained at a speed of
1500 rpm. When the flow volume per unit of time is increased, the speed of rotation
tends to increase gradually. However, the torque does not increase proportionally
with increases in water flow. Crosses in Fig. 12.19 indicate simulated results
obtained using 3D CFD software with a water flow of 1 L/s. The variation in torque
is in good agreement with the corresponding analytical result plotted with circles. It
is important to set the optimum conditions for the drainage water generation system
to provide maximum torque in order to extract sufficient energy.
12.5 Prospects and Challenges of Active Use of Natural
Clean Energy
12.5.1 Hybrid Use of Different Types of Natural Energy
The main aim of this chapter is to present a new concept for realization of a
low-carbon society based on the transition to natural clean energy sources from
0.09
0.08
0.07
0.06
0.05
0.04
Torque (N.m)
0.03
0.02
0.01
0
0
500
1000 1500 2000
Speed of rotation (rpm)
2500 3000 3500 4000
1L/s
2L/s
3L/s
Simulation
(1L/s)
4500
Fig. 12.19 Relationship between torque and speed of rotation of water mill axle
234
T. Sakai et al.
the pressure of the water flow tends to give a higher value around the edge, directly
facing the blades of the water mill. Water tends to flow along the inner surface of the
pipe, whereas the core portion inside the pipe is occupied almost entirely by air. This
allows high levels of energy to be harnessed from drainage water with high
efficiency.
Finally, the relationships between the torque of the revolution axle of the water
mill and the speed of rotation are shown in Fig. 12.19. Three different water flow
conditions were used for analysis: 1, 2, and 3 L/s. The torque acting on the water mill
axle tends to increase with increased speed of rotation but decreases after peaking at
1500 rpm. Based on these results, maximum torque can be obtained at a speed of
1500 rpm. When the flow volume per unit of time is increased, the speed of rotation
tends to increase gradually. However, the torque does not increase proportionally
with increases in water flow. Crosses in Fig. 12.19 indicate simulated results
obtained using 3D CFD software with a water flow of 1 L/s. The variation in torque
is in good agreement with the corresponding analytical result plotted with circles. It
is important to set the optimum conditions for the drainage water generation system
to provide maximum torque in order to extract sufficient energy.
12.5 Prospects and Challenges of Active Use of Natural
Clean Energy
12.5.1 Hybrid Use of Different Types of Natural Energy
The main aim of this chapter is to present a new concept for realization of a
low-carbon society based on the transition to natural clean energy sources from
0.09
0.08
0.07
0.06
0.05
0.04
Torque (N.m)
0.03
0.02
0.01
0
0
500
1000 1500 2000
Speed of rotation (rpm)
2500 3000 3500 4000
1L/s
2L/s
3L/s
Simulation
(1L/s)
4500
Fig. 12.19 Relationship between torque and speed of rotation of water mill axle
234
T. Sakai et al.