

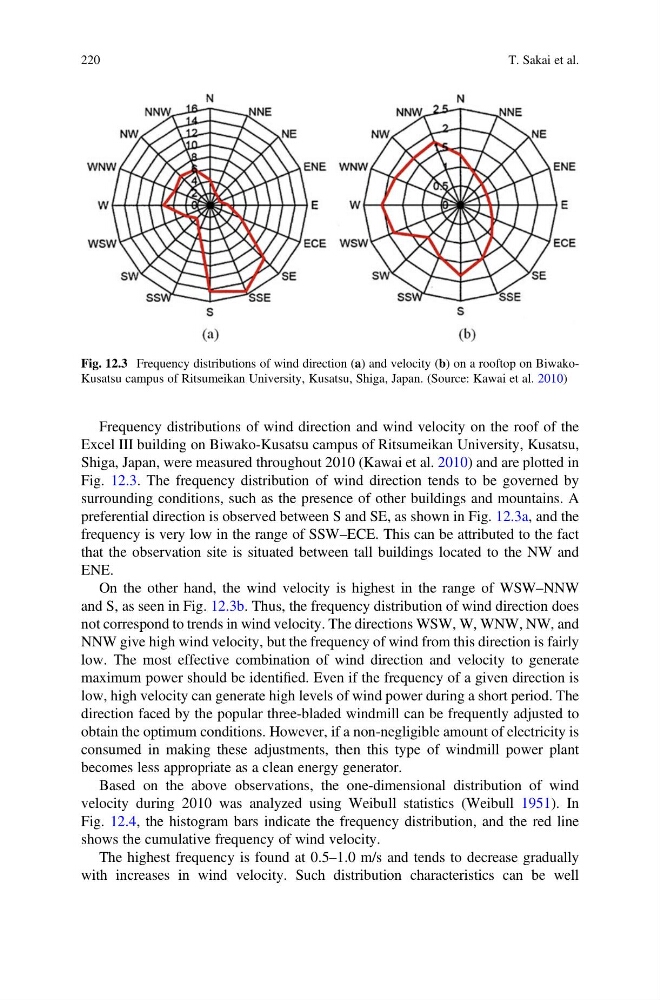
Frequency distributions of wind direction and wind velocity on the roof of the
Excel III building on Biwako-Kusatsu campus of Ritsumeikan University, Kusatsu,
Shiga, Japan, were measured throughout 2010 (Kawai et al. 2010) and are plotted in
Fig. 12.3. The frequency distribution of wind direction tends to be governed by
surrounding conditions, such as the presence of other buildings and mountains. A
preferential direction is observed between S and SE, as shown in Fig. 12.3a, and the
frequency is very low in the range of SSW–ECE. This can be attributed to the fact
that the observation site is situated between tall buildings located to the NW and
ENE.
On the other hand, the wind velocity is highest in the range of WSW–NNW
and S, as seen in Fig. 12.3b. Thus, the frequency distribution of wind direction does
not correspond to trends in wind velocity. The directions WSW, W, WNW, NW, and
NNW give high wind velocity, but the frequency of wind from this direction is fairly
low. The most effective combination of wind direction and velocity to generate
maximum power should be identified. Even if the frequency of a given direction is
low, high velocity can generate high levels of wind power during a short period. The
direction faced by the popular three-bladed windmill can be frequently adjusted to
obtain the optimum conditions. However, if a non-negligible amount of electricity is
consumed in making these adjustments, then this type of windmill power plant
becomes less appropriate as a clean energy generator.
Based on the above observations, the one-dimensional distribution of wind
velocity during 2010 was analyzed using Weibull statistics (Weibull 1951). In
Fig. 12.4, the histogram bars indicate the frequency distribution, and the red line
shows the cumulative frequency of wind velocity.
The highest frequency is found at 0.5–1.0 m/s and tends to decrease gradually
with increases in wind velocity. Such distribution characteristics can be well
Fig. 12.3 Frequency distributions of wind direction (a) and velocity (b) on a rooftop on BiwakoKusatsu campus of Ritsumeikan University, Kusatsu, Shiga, Japan. (Source: Kawai et al. 2010)
220
T. Sakai et al.
Excel III building on Biwako-Kusatsu campus of Ritsumeikan University, Kusatsu,
Shiga, Japan, were measured throughout 2010 (Kawai et al. 2010) and are plotted in
Fig. 12.3. The frequency distribution of wind direction tends to be governed by
surrounding conditions, such as the presence of other buildings and mountains. A
preferential direction is observed between S and SE, as shown in Fig. 12.3a, and the
frequency is very low in the range of SSW–ECE. This can be attributed to the fact
that the observation site is situated between tall buildings located to the NW and
ENE.
On the other hand, the wind velocity is highest in the range of WSW–NNW
and S, as seen in Fig. 12.3b. Thus, the frequency distribution of wind direction does
not correspond to trends in wind velocity. The directions WSW, W, WNW, NW, and
NNW give high wind velocity, but the frequency of wind from this direction is fairly
low. The most effective combination of wind direction and velocity to generate
maximum power should be identified. Even if the frequency of a given direction is
low, high velocity can generate high levels of wind power during a short period. The
direction faced by the popular three-bladed windmill can be frequently adjusted to
obtain the optimum conditions. However, if a non-negligible amount of electricity is
consumed in making these adjustments, then this type of windmill power plant
becomes less appropriate as a clean energy generator.
Based on the above observations, the one-dimensional distribution of wind
velocity during 2010 was analyzed using Weibull statistics (Weibull 1951). In
Fig. 12.4, the histogram bars indicate the frequency distribution, and the red line
shows the cumulative frequency of wind velocity.
The highest frequency is found at 0.5–1.0 m/s and tends to decrease gradually
with increases in wind velocity. Such distribution characteristics can be well
Fig. 12.3 Frequency distributions of wind direction (a) and velocity (b) on a rooftop on BiwakoKusatsu campus of Ritsumeikan University, Kusatsu, Shiga, Japan. (Source: Kawai et al. 2010)
220
T. Sakai et al.