

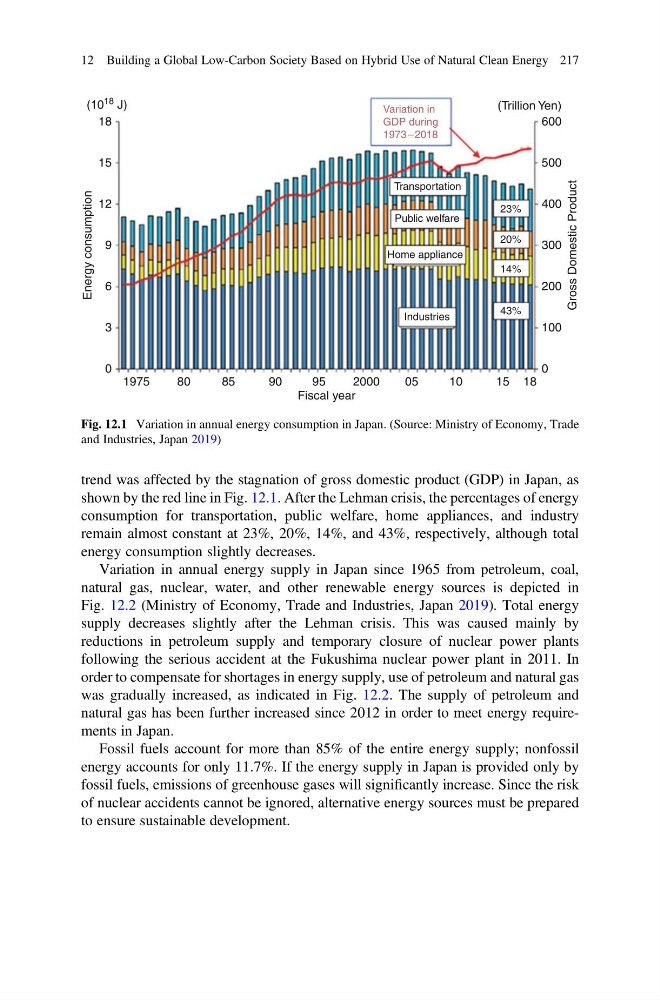
trend was affected by the stagnation of gross domestic product (GDP) in Japan, as
shown by the red line in Fig. 12.1. After the Lehman crisis, the percentages of energy
consumption for transportation, public welfare, home appliances, and industry
remain almost constant at 23%, 20%, 14%, and 43%, respectively, although total
energy consumption slightly decreases.
Variation in annual energy supply in Japan since 1965 from petroleum, coal,
natural gas, nuclear, water, and other renewable energy sources is depicted in
Fig. 12.2 (Ministry of Economy, Trade and Industries, Japan 2019). Total energy
supply decreases slightly after the Lehman crisis. This was caused mainly by
reductions in petroleum supply and temporary closure of nuclear power plants
following the serious accident at the Fukushima nuclear power plant in 2011. In
order to compensate for shortages in energy supply, use of petroleum and natural gas
was gradually increased, as indicated in Fig. 12.2. The supply of petroleum and
natural gas has been further increased since 2012 in order to meet energy requirements in Japan.
Fossil fuels account for more than 85% of the entire energy supply; nonfossil
energy accounts for only 11.7%. If the energy supply in Japan is provided only by
fossil fuels, emissions of greenhouse gases will significantly increase. Since the risk
of nuclear accidents cannot be ignored, alternative energy sources must be prepared
to ensure sustainable development.
(10
18 J)
Energy consumption
18
15
12
9
6
3
0
Fiscal year
1975
80
85
90
95
2000
05
10
15 18
Gross Domestic Product
43%
Industries
Home appliance
Public welfare
Transportation
Variation in
GDP during
1973 –2018
14%
20%
23%
0
200
100
300
400
500
600
(Trillion Yen)
Fig. 12.1 Variation in annual energy consumption in Japan. (Source: Ministry of Economy, Trade
and Industries, Japan 2019)
12 Building a Global Low-Carbon Society Based on Hybrid Use of Natural Clean Energy 217
shown by the red line in Fig. 12.1. After the Lehman crisis, the percentages of energy
consumption for transportation, public welfare, home appliances, and industry
remain almost constant at 23%, 20%, 14%, and 43%, respectively, although total
energy consumption slightly decreases.
Variation in annual energy supply in Japan since 1965 from petroleum, coal,
natural gas, nuclear, water, and other renewable energy sources is depicted in
Fig. 12.2 (Ministry of Economy, Trade and Industries, Japan 2019). Total energy
supply decreases slightly after the Lehman crisis. This was caused mainly by
reductions in petroleum supply and temporary closure of nuclear power plants
following the serious accident at the Fukushima nuclear power plant in 2011. In
order to compensate for shortages in energy supply, use of petroleum and natural gas
was gradually increased, as indicated in Fig. 12.2. The supply of petroleum and
natural gas has been further increased since 2012 in order to meet energy requirements in Japan.
Fossil fuels account for more than 85% of the entire energy supply; nonfossil
energy accounts for only 11.7%. If the energy supply in Japan is provided only by
fossil fuels, emissions of greenhouse gases will significantly increase. Since the risk
of nuclear accidents cannot be ignored, alternative energy sources must be prepared
to ensure sustainable development.
(10
18 J)
Energy consumption
18
15
12
9
6
3
0
Fiscal year
1975
80
85
90
95
2000
05
10
15 18
Gross Domestic Product
43%
Industries
Home appliance
Public welfare
Transportation
Variation in
GDP during
1973 –2018
14%
20%
23%
0
200
100
300
400
500
600
(Trillion Yen)
Fig. 12.1 Variation in annual energy consumption in Japan. (Source: Ministry of Economy, Trade
and Industries, Japan 2019)
12 Building a Global Low-Carbon Society Based on Hybrid Use of Natural Clean Energy 217