

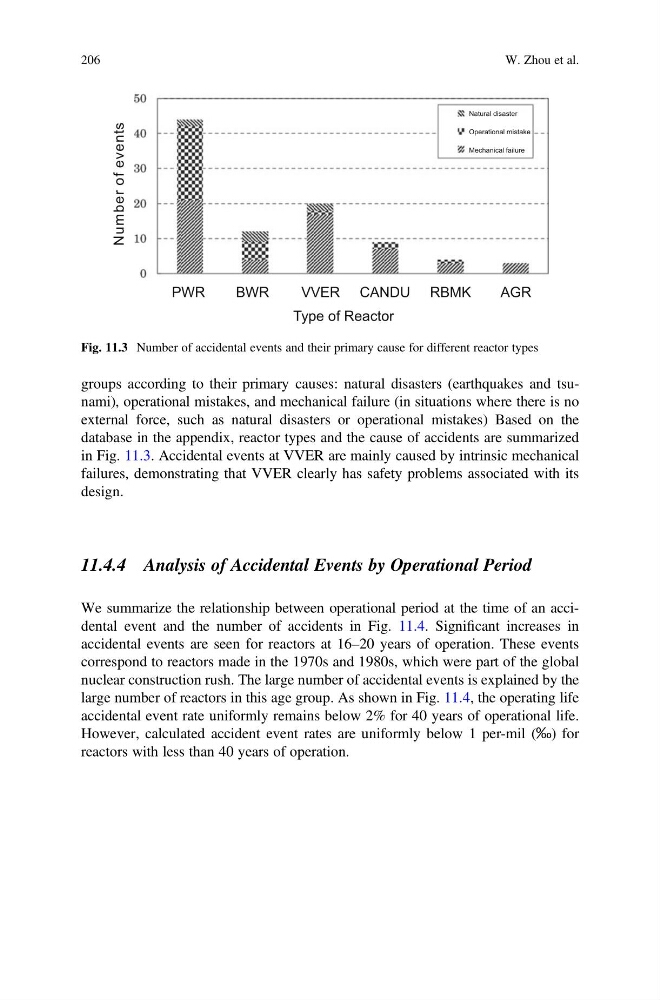
groups according to their primary causes: natural disasters (earthquakes and tsunami), operational mistakes, and mechanical failure (in situations where there is no
external force, such as natural disasters or operational mistakes) Based on the
database in the appendix, reactor types and the cause of accidents are summarized
in Fig. 11.3. Accidental events at VVER are mainly caused by intrinsic mechanical
failures, demonstrating that VVER clearly has safety problems associated with its
design.
11.4.4 Analysis of Accidental Events by Operational Period
We summarize the relationship between operational period at the time of an accidental event and the number of accidents in Fig. 11.4. Significant increases in
accidental events are seen for reactors at 16–20 years of operation. These events
correspond to reactors made in the 1970s and 1980s, which were part of the global
nuclear construction rush. The large number of accidental events is explained by the
large number of reactors in this age group. As shown in Fig. 11.4, the operating life
accidental event rate uniformly remains below 2% for 40 years of operational life.
However, calculated accident event rates are uniformly below 1 per-mil (‰) for
reactors with less than 40 years of operation.
s
t
n
e
v
e
f
o
r
e
b
m
u
N
Natural disaster
Operational mistake
Mechanical failure
PWR
BWR
VVER CANDU RBMK
AGR
Type of Reactor
Fig. 11.3 Number of accidental events and their primary cause for different reactor types
206
W. Zhou et al.
external force, such as natural disasters or operational mistakes) Based on the
database in the appendix, reactor types and the cause of accidents are summarized
in Fig. 11.3. Accidental events at VVER are mainly caused by intrinsic mechanical
failures, demonstrating that VVER clearly has safety problems associated with its
design.
11.4.4 Analysis of Accidental Events by Operational Period
We summarize the relationship between operational period at the time of an accidental event and the number of accidents in Fig. 11.4. Significant increases in
accidental events are seen for reactors at 16–20 years of operation. These events
correspond to reactors made in the 1970s and 1980s, which were part of the global
nuclear construction rush. The large number of accidental events is explained by the
large number of reactors in this age group. As shown in Fig. 11.4, the operating life
accidental event rate uniformly remains below 2% for 40 years of operational life.
However, calculated accident event rates are uniformly below 1 per-mil (‰) for
reactors with less than 40 years of operation.
s
t
n
e
v
e
f
o
r
e
b
m
u
N
Natural disaster
Operational mistake
Mechanical failure
PWR
BWR
VVER CANDU RBMK
AGR
Type of Reactor
Fig. 11.3 Number of accidental events and their primary cause for different reactor types
206
W. Zhou et al.