

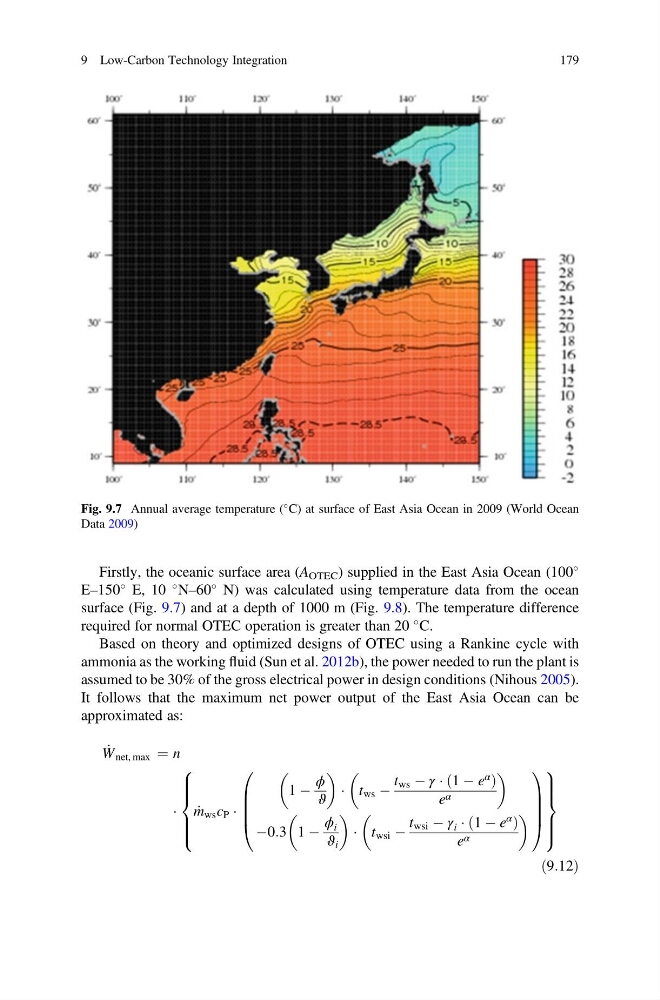
Firstly, the oceanic surface area (A OTEC ) supplied in the East Asia Ocean (100
E–150
E, 10
N–60
N) was calculated using temperature data from the ocean
surface (Fig. 9.7) and at a depth of 1000 m (Fig. 9.8). The temperature difference
required for normal OTEC operation is greater than 20
C.
Based on theory and optimized designs of OTEC using a Rankine cycle with
ammonia as the working fluid (Sun et al. 2012b), the power needed to run the plant is
assumed to be 30% of the gross electrical power in design conditions (Nihous 2005).
It follows that the maximum net power output of the East Asia Ocean can be
approximated as:
_
W net, max ¼ n
Á _
m ws c P Á
1 À
ϕ
ϑ
Á t ws À
t ws À γ Á 1 À e
α
ð
Þ
e α
À0:3 1 À
ϕ i
ϑ i
Á t wsi À
t wsi À γ i Á 1 À e
α
ð
Þ
e α
0
B
B
B
@
1
C
C
C
A
8
> > > <
> > > :
9
> > > =
> > > ;
ð9:12Þ
Fig. 9.7 Annual average temperature (
C) at surface of East Asia Ocean in 2009 (World Ocean
Data 2009)
9 Low-Carbon Technology Integration
179
E–150
E, 10
N–60
N) was calculated using temperature data from the ocean
surface (Fig. 9.7) and at a depth of 1000 m (Fig. 9.8). The temperature difference
required for normal OTEC operation is greater than 20
C.
Based on theory and optimized designs of OTEC using a Rankine cycle with
ammonia as the working fluid (Sun et al. 2012b), the power needed to run the plant is
assumed to be 30% of the gross electrical power in design conditions (Nihous 2005).
It follows that the maximum net power output of the East Asia Ocean can be
approximated as:
_
W net, max ¼ n
Á _
m ws c P Á
1 À
ϕ
ϑ
Á t ws À
t ws À γ Á 1 À e
α
ð
Þ
e α
À0:3 1 À
ϕ i
ϑ i
Á t wsi À
t wsi À γ i Á 1 À e
α
ð
Þ
e α
0
B
B
B
@
1
C
C
C
A
8
> > > <
> > > :
9
> > > =
> > > ;
ð9:12Þ
Fig. 9.7 Annual average temperature (
C) at surface of East Asia Ocean in 2009 (World Ocean
Data 2009)
9 Low-Carbon Technology Integration
179