

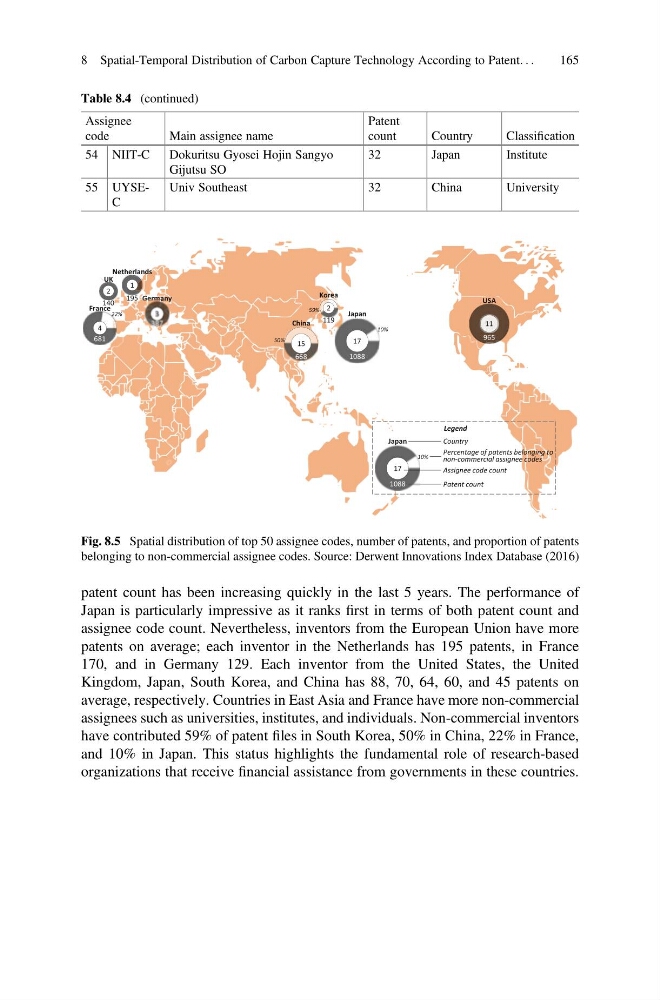
patent count has been increasing quickly in the last 5 years. The performance of
Japan is particularly impressive as it ranks first in terms of both patent count and
assignee code count. Nevertheless, inventors from the European Union have more
patents on average; each inventor in the Netherlands has 195 patents, in France
170, and in Germany 129. Each inventor from the United States, the United
Kingdom, Japan, South Korea, and China has 88, 70, 64, 60, and 45 patents on
average, respectively. Countries in East Asia and France have more non-commercial
assignees such as universities, institutes, and individuals. Non-commercial inventors
have contributed 59% of patent files in South Korea, 50% in China, 22% in France,
and 10% in Japan. This status highlights the fundamental role of research-based
organizations that receive financial assistance from governments in these countries.
Table 8.4 (continued)
Assignee
code
Main assignee name
Patent
count
Country
Classification
54 NIIT-C
Dokuritsu Gyosei Hojin Sangyo
Gijutsu SO
32
Japan
Institute
55 UYSEC
Univ Southeast
32
China
University
11
965
USA
17
1088
Japan
10%
15
668
China
50%
2
119
Korea
59%
3
387
Germany
2
140
UK
4
681
France
22%
1
195
Netherlands
Country
Patent count
Percentage of patents belonging to
non-commercial assignee codes
17
1088
Japan
10%
Assignee code count
Legend
Fig. 8.5 Spatial distribution of top 50 assignee codes, number of patents, and proportion of patents
belonging to non-commercial assignee codes. Source: Derwent Innovations Index Database (2016)
8 Spatial-Temporal Distribution of Carbon Capture Technology According to Patent. . .
165
Japan is particularly impressive as it ranks first in terms of both patent count and
assignee code count. Nevertheless, inventors from the European Union have more
patents on average; each inventor in the Netherlands has 195 patents, in France
170, and in Germany 129. Each inventor from the United States, the United
Kingdom, Japan, South Korea, and China has 88, 70, 64, 60, and 45 patents on
average, respectively. Countries in East Asia and France have more non-commercial
assignees such as universities, institutes, and individuals. Non-commercial inventors
have contributed 59% of patent files in South Korea, 50% in China, 22% in France,
and 10% in Japan. This status highlights the fundamental role of research-based
organizations that receive financial assistance from governments in these countries.
Table 8.4 (continued)
Assignee
code
Main assignee name
Patent
count
Country
Classification
54 NIIT-C
Dokuritsu Gyosei Hojin Sangyo
Gijutsu SO
32
Japan
Institute
55 UYSEC
Univ Southeast
32
China
University
11
965
USA
17
1088
Japan
10%
15
668
China
50%
2
119
Korea
59%
3
387
Germany
2
140
UK
4
681
France
22%
1
195
Netherlands
Country
Patent count
Percentage of patents belonging to
non-commercial assignee codes
17
1088
Japan
10%
Assignee code count
Legend
Fig. 8.5 Spatial distribution of top 50 assignee codes, number of patents, and proportion of patents
belonging to non-commercial assignee codes. Source: Derwent Innovations Index Database (2016)
8 Spatial-Temporal Distribution of Carbon Capture Technology According to Patent. . .
165