

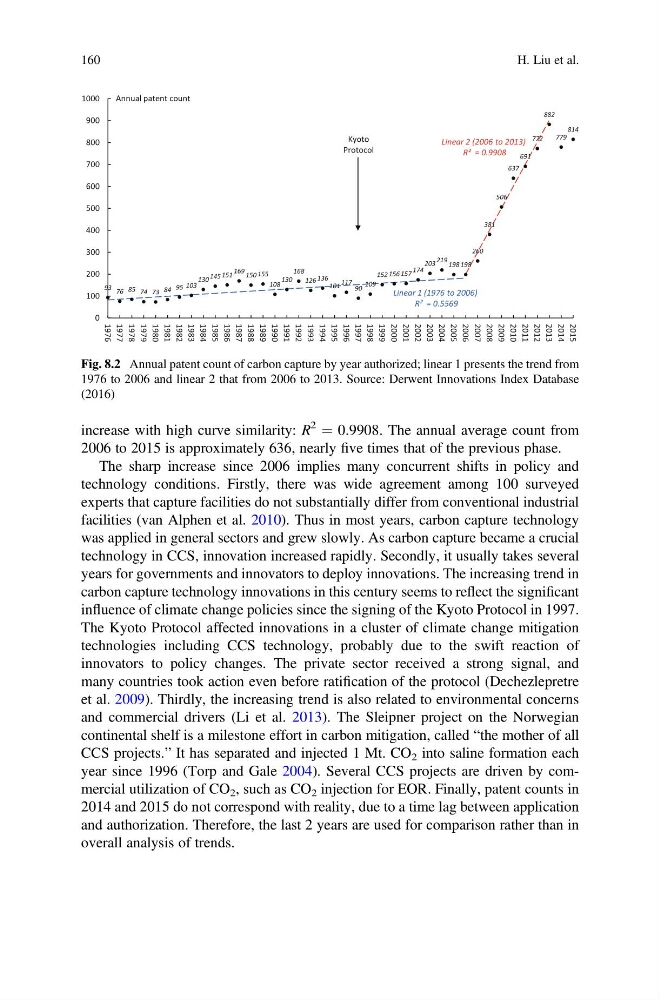
increase with high curve similarity: R
2
¼ 0.9908. The annual average count from
2006 to 2015 is approximately 636, nearly five times that of the previous phase.
The sharp increase since 2006 implies many concurrent shifts in policy and
technology conditions. Firstly, there was wide agreement among 100 surveyed
experts that capture facilities do not substantially differ from conventional industrial
facilities (van Alphen et al. 2010). Thus in most years, carbon capture technology
was applied in general sectors and grew slowly. As carbon capture became a crucial
technology in CCS, innovation increased rapidly. Secondly, it usually takes several
years for governments and innovators to deploy innovations. The increasing trend in
carbon capture technology innovations in this century seems to reflect the significant
influence of climate change policies since the signing of the Kyoto Protocol in 1997.
The Kyoto Protocol affected innovations in a cluster of climate change mitigation
technologies including CCS technology, probably due to the swift reaction of
innovators to policy changes. The private sector received a strong signal, and
many countries took action even before ratification of the protocol (Dechezlepretre
et al. 2009). Thirdly, the increasing trend is also related to environmental concerns
and commercial drivers (Li et al. 2013). The Sleipner project on the Norwegian
continental shelf is a milestone effort in carbon mitigation, called “the mother of all
CCS projects.” It has separated and injected 1 Mt. CO 2 into saline formation each
year since 1996 (Torp and Gale 2004). Several CCS projects are driven by commercial utilization of CO 2 , such as CO 2 injection for EOR. Finally, patent counts in
2014 and 2015 do not correspond with reality, due to a time lag between application
and authorization. Therefore, the last 2 years are used for comparison rather than in
overall analysis of trends.
Linear 1 (1976 to 2006)
R² = 0.5569
Linear 2 (2006 to 2013)
R² = 0.9908
Kyoto
Protocol
93 76 85 74 73 84 95 103
130 145 151
169 150 155
108
130
168
126 136
101 117
90
109
152 156 157
174
203 219 198 198
260
381
506
637
691
772
882
779
814
0
100
200
300
400
500
600
700
800
900
1000
1976
1977
1978
1979
1980
1981
1982
1983
1984
1985
1986
1987
1988
1989
1990
1991
1992
1993
1994
1995
1996
1997
1998
1999
2000
2001
2002
2003
2004
2005
2006
2007
2008
2009
2010
2011
2012
2013
2014
2015
Annual patent count
Fig. 8.2 Annual patent count of carbon capture by year authorized; linear 1 presents the trend from
1976 to 2006 and linear 2 that from 2006 to 2013. Source: Derwent Innovations Index Database
(2016)
160
H. Liu et al.
2
¼ 0.9908. The annual average count from
2006 to 2015 is approximately 636, nearly five times that of the previous phase.
The sharp increase since 2006 implies many concurrent shifts in policy and
technology conditions. Firstly, there was wide agreement among 100 surveyed
experts that capture facilities do not substantially differ from conventional industrial
facilities (van Alphen et al. 2010). Thus in most years, carbon capture technology
was applied in general sectors and grew slowly. As carbon capture became a crucial
technology in CCS, innovation increased rapidly. Secondly, it usually takes several
years for governments and innovators to deploy innovations. The increasing trend in
carbon capture technology innovations in this century seems to reflect the significant
influence of climate change policies since the signing of the Kyoto Protocol in 1997.
The Kyoto Protocol affected innovations in a cluster of climate change mitigation
technologies including CCS technology, probably due to the swift reaction of
innovators to policy changes. The private sector received a strong signal, and
many countries took action even before ratification of the protocol (Dechezlepretre
et al. 2009). Thirdly, the increasing trend is also related to environmental concerns
and commercial drivers (Li et al. 2013). The Sleipner project on the Norwegian
continental shelf is a milestone effort in carbon mitigation, called “the mother of all
CCS projects.” It has separated and injected 1 Mt. CO 2 into saline formation each
year since 1996 (Torp and Gale 2004). Several CCS projects are driven by commercial utilization of CO 2 , such as CO 2 injection for EOR. Finally, patent counts in
2014 and 2015 do not correspond with reality, due to a time lag between application
and authorization. Therefore, the last 2 years are used for comparison rather than in
overall analysis of trends.
Linear 1 (1976 to 2006)
R² = 0.5569
Linear 2 (2006 to 2013)
R² = 0.9908
Kyoto
Protocol
93 76 85 74 73 84 95 103
130 145 151
169 150 155
108
130
168
126 136
101 117
90
109
152 156 157
174
203 219 198 198
260
381
506
637
691
772
882
779
814
0
100
200
300
400
500
600
700
800
900
1000
1976
1977
1978
1979
1980
1981
1982
1983
1984
1985
1986
1987
1988
1989
1990
1991
1992
1993
1994
1995
1996
1997
1998
1999
2000
2001
2002
2003
2004
2005
2006
2007
2008
2009
2010
2011
2012
2013
2014
2015
Annual patent count
Fig. 8.2 Annual patent count of carbon capture by year authorized; linear 1 presents the trend from
1976 to 2006 and linear 2 that from 2006 to 2013. Source: Derwent Innovations Index Database
(2016)
160
H. Liu et al.