

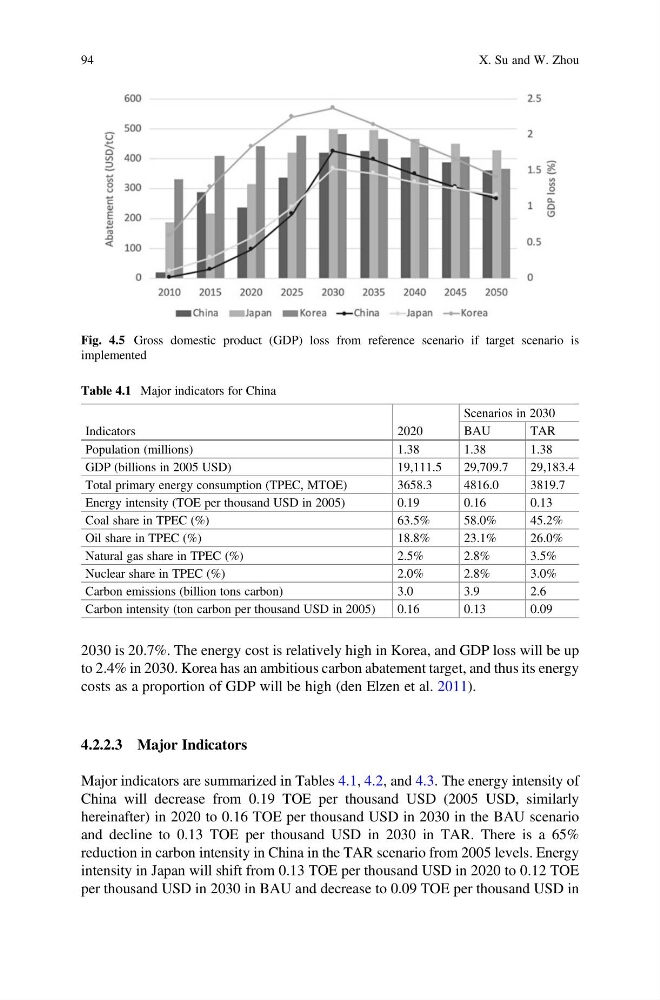
2030 is 20.7%. The energy cost is relatively high in Korea, and GDP loss will be up
to 2.4% in 2030. Korea has an ambitious carbon abatement target, and thus its energy
costs as a proportion of GDP will be high (den Elzen et al. 2011).
4.2.2.3 Major Indicators
Major indicators are summarized in Tables 4.1, 4.2, and 4.3. The energy intensity of
China will decrease from 0.19 TOE per thousand USD (2005 USD, similarly
hereinafter) in 2020 to 0.16 TOE per thousand USD in 2030 in the BAU scenario
and decline to 0.13 TOE per thousand USD in 2030 in TAR. There is a 65%
reduction in carbon intensity in China in the TAR scenario from 2005 levels. Energy
intensity in Japan will shift from 0.13 TOE per thousand USD in 2020 to 0.12 TOE
per thousand USD in 2030 in BAU and decrease to 0.09 TOE per thousand USD in
Fig. 4.5 Gross domestic product (GDP) loss from reference scenario if target scenario is
implemented
Table 4.1 Major indicators for China
Indicators
2020
Scenarios in 2030
BAU
TAR
Population (millions)
1.38
1.38
1.38
GDP (billions in 2005 USD)
19,111.5
29,709.7
29,183.4
Total primary energy consumption (TPEC, MTOE)
3658.3
4816.0
3819.7
Energy intensity (TOE per thousand USD in 2005)
0.19
0.16
0.13
Coal share in TPEC (%)
63.5%
58.0%
45.2%
Oil share in TPEC (%)
18.8%
23.1%
26.0%
Natural gas share in TPEC (%)
2.5%
2.8%
3.5%
Nuclear share in TPEC (%)
2.0%
2.8%
3.0%
Carbon emissions (billion tons carbon)
3.0
3.9
2.6
Carbon intensity (ton carbon per thousand USD in 2005)
0.16
0.13
0.09
94
X. Su and W. Zhou
to 2.4% in 2030. Korea has an ambitious carbon abatement target, and thus its energy
costs as a proportion of GDP will be high (den Elzen et al. 2011).
4.2.2.3 Major Indicators
Major indicators are summarized in Tables 4.1, 4.2, and 4.3. The energy intensity of
China will decrease from 0.19 TOE per thousand USD (2005 USD, similarly
hereinafter) in 2020 to 0.16 TOE per thousand USD in 2030 in the BAU scenario
and decline to 0.13 TOE per thousand USD in 2030 in TAR. There is a 65%
reduction in carbon intensity in China in the TAR scenario from 2005 levels. Energy
intensity in Japan will shift from 0.13 TOE per thousand USD in 2020 to 0.12 TOE
per thousand USD in 2030 in BAU and decrease to 0.09 TOE per thousand USD in
Fig. 4.5 Gross domestic product (GDP) loss from reference scenario if target scenario is
implemented
Table 4.1 Major indicators for China
Indicators
2020
Scenarios in 2030
BAU
TAR
Population (millions)
1.38
1.38
1.38
GDP (billions in 2005 USD)
19,111.5
29,709.7
29,183.4
Total primary energy consumption (TPEC, MTOE)
3658.3
4816.0
3819.7
Energy intensity (TOE per thousand USD in 2005)
0.19
0.16
0.13
Coal share in TPEC (%)
63.5%
58.0%
45.2%
Oil share in TPEC (%)
18.8%
23.1%
26.0%
Natural gas share in TPEC (%)
2.5%
2.8%
3.5%
Nuclear share in TPEC (%)
2.0%
2.8%
3.0%
Carbon emissions (billion tons carbon)
3.0
3.9
2.6
Carbon intensity (ton carbon per thousand USD in 2005)
0.16
0.13
0.09
94
X. Su and W. Zhou