

3.1 Liquid Structure
59
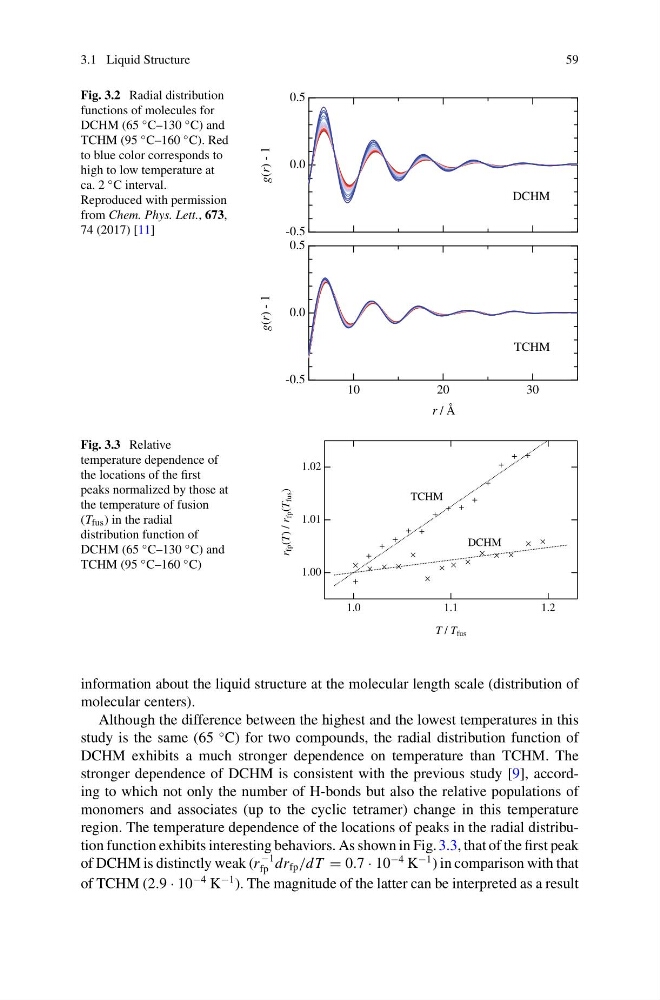
Fig. 3.2 Radial distribution
functions of molecules for
DCHM (65 ◦ C–130 ◦ C) and
TCHM (95 ◦ C–160 ◦ C). Red
to blue color corresponds to
high to low temperature at
ca. 2 ◦ C interval.
Reproduced with permission
from Chem. Phys. Lett., 673,
74 (2017) [11]
r / Å
-0.5
0.0
0.5
g(r)
- 1
DCHM
-0.5
0.0
0.5
g(r)
- 1
30
20
10
TCHM
Fig. 3.3 Relative
temperature dependence of
the locations of the first
peaks normalized by those at
the temperature of fusion
(T fus ) in the radial
distribution function of
DCHM (65 ◦ C–130 ◦ C) and
TCHM (95 ◦ C–160 ◦ C)
1.02
1.01
1.00
r
fp (T) / r
fp (T
fus )
1.2
1.1
1.0
T / T fus
TCHM
DCHM
information about the liquid structure at the molecular length scale (distribution of
molecular centers).
Although the difference between the highest and the lowest temperatures in this
study is the same (65
◦ C) for two compounds, the radial distribution function of
DCHM exhibits a much stronger dependence on temperature than TCHM. The
stronger dependence of DCHM is consistent with the previous study [9], according to which not only the number of H-bonds but also the relative populations of
monomers and associates (up to the cyclic tetramer) change in this temperature
region. The temperature dependence of the locations of peaks in the radial distribution function exhibits interesting behaviors. As shown in Fig. 3.3, that of the first peak
of DCHM is distinctly weak (r
−1
fp dr fp /dT = 0.7 · 10
−4 K
−1 ) in comparison with that
of TCHM (2.9 · 10
−4 K
−1 ). The magnitude of the latter can be interpreted as a result
59
Fig. 3.2 Radial distribution
functions of molecules for
DCHM (65 ◦ C–130 ◦ C) and
TCHM (95 ◦ C–160 ◦ C). Red
to blue color corresponds to
high to low temperature at
ca. 2 ◦ C interval.
Reproduced with permission
from Chem. Phys. Lett., 673,
74 (2017) [11]
r / Å
-0.5
0.0
0.5
g(r)
- 1
DCHM
-0.5
0.0
0.5
g(r)
- 1
30
20
10
TCHM
Fig. 3.3 Relative
temperature dependence of
the locations of the first
peaks normalized by those at
the temperature of fusion
(T fus ) in the radial
distribution function of
DCHM (65 ◦ C–130 ◦ C) and
TCHM (95 ◦ C–160 ◦ C)
1.02
1.01
1.00
r
fp (T) / r
fp (T
fus )
1.2
1.1
1.0
T / T fus
TCHM
DCHM
information about the liquid structure at the molecular length scale (distribution of
molecular centers).
Although the difference between the highest and the lowest temperatures in this
study is the same (65
◦ C) for two compounds, the radial distribution function of
DCHM exhibits a much stronger dependence on temperature than TCHM. The
stronger dependence of DCHM is consistent with the previous study [9], according to which not only the number of H-bonds but also the relative populations of
monomers and associates (up to the cyclic tetramer) change in this temperature
region. The temperature dependence of the locations of peaks in the radial distribution function exhibits interesting behaviors. As shown in Fig. 3.3, that of the first peak
of DCHM is distinctly weak (r
−1
fp dr fp /dT = 0.7 · 10
−4 K
−1 ) in comparison with that
of TCHM (2.9 · 10
−4 K
−1 ). The magnitude of the latter can be interpreted as a result