

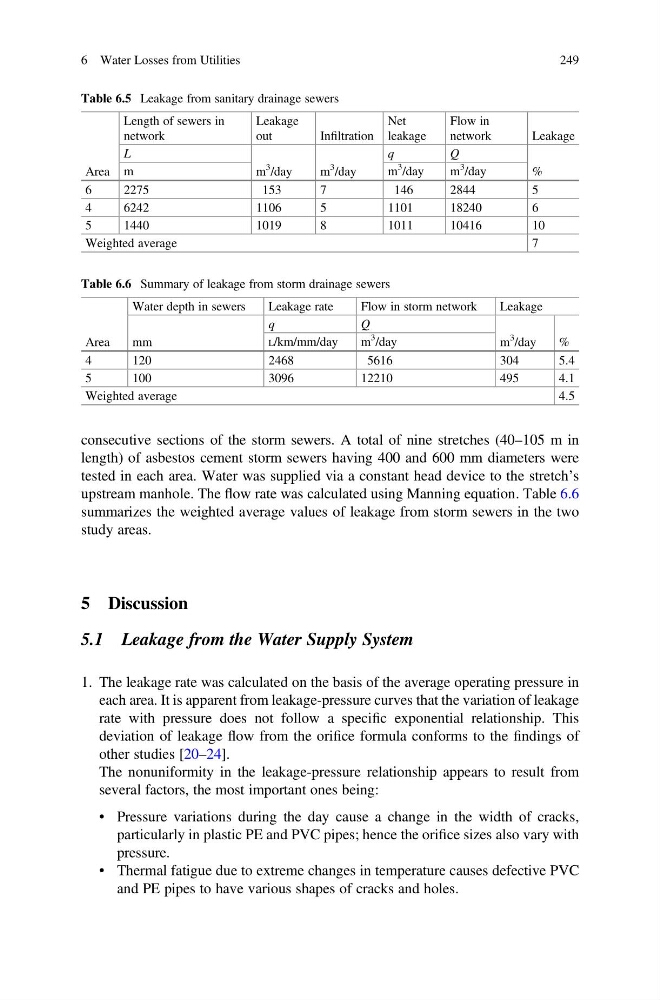
consecutive sections of the storm sewers. A total of nine stretches (40–105 m in
length) of asbestos cement storm sewers having 400 and 600 mm diameters were
tested in each area. Water was supplied via a constant head device to the stretch’s
upstream manhole. The flow rate was calculated using Manning equation. Table 6.6
summarizes the weighted average values of leakage from storm sewers in the two
study areas.
5 Discussion
5.1 Leakage from the Water Supply System
1. The leakage rate was calculated on the basis of the average operating pressure in
each area. It is apparent from leakage-pressure curves that the variation of leakage
rate with pressure does not follow a specific exponential relationship. This
deviation of leakage flow from the orifice formula conforms to the findings of
other studies [20–24].
The nonuniformity in the leakage-pressure relationship appears to result from
several factors, the most important ones being:
• Pressure variations during the day cause a change in the width of cracks,
particularly in plastic PE and PVC pipes; hence the orifice sizes also vary with
pressure.
• Thermal fatigue due to extreme changes in temperature causes defective PVC
and PE pipes to have various shapes of cracks and holes.
Table 6.5 Leakage from sanitary drainage sewers
Area
Length of sewers in
network
Leakage
out
Infiltration
Net
leakage
Flow in
network
Leakage
L
m
3
/day
m
3
/day
q
Q
%
m
m
3
/day
m
3
/day
6
2275
153
7
146
2844
5
4
6242
1106
5
1101
18240
6
5
1440
1019
8
1011
10416
10
Weighted average
7
Table 6.6 Summary of leakage from storm drainage sewers
Area
Water depth in sewers
Leakage rate
Flow in storm network
Leakage
mm
q
Q
m
3
/day
%
L/km/mm/day
m
3
/day
4
120
2468
5616
304
5.4
5
100
3096
12210
495
4.1
Weighted average
4.5
6 Water Losses from Utilities
249
length) of asbestos cement storm sewers having 400 and 600 mm diameters were
tested in each area. Water was supplied via a constant head device to the stretch’s
upstream manhole. The flow rate was calculated using Manning equation. Table 6.6
summarizes the weighted average values of leakage from storm sewers in the two
study areas.
5 Discussion
5.1 Leakage from the Water Supply System
1. The leakage rate was calculated on the basis of the average operating pressure in
each area. It is apparent from leakage-pressure curves that the variation of leakage
rate with pressure does not follow a specific exponential relationship. This
deviation of leakage flow from the orifice formula conforms to the findings of
other studies [20–24].
The nonuniformity in the leakage-pressure relationship appears to result from
several factors, the most important ones being:
• Pressure variations during the day cause a change in the width of cracks,
particularly in plastic PE and PVC pipes; hence the orifice sizes also vary with
pressure.
• Thermal fatigue due to extreme changes in temperature causes defective PVC
and PE pipes to have various shapes of cracks and holes.
Table 6.5 Leakage from sanitary drainage sewers
Area
Length of sewers in
network
Leakage
out
Infiltration
Net
leakage
Flow in
network
Leakage
L
m
3
/day
m
3
/day
q
Q
%
m
m
3
/day
m
3
/day
6
2275
153
7
146
2844
5
4
6242
1106
5
1101
18240
6
5
1440
1019
8
1011
10416
10
Weighted average
7
Table 6.6 Summary of leakage from storm drainage sewers
Area
Water depth in sewers
Leakage rate
Flow in storm network
Leakage
mm
q
Q
m
3
/day
%
L/km/mm/day
m
3
/day
4
120
2468
5616
304
5.4
5
100
3096
12210
495
4.1
Weighted average
4.5
6 Water Losses from Utilities
249