

(BOD). The equation was derived by Streeter and Phelps in 1925, based on field data
from the Ohio River. The equation is also known as the DO sag equation. It
determines the relation between the dissolved oxygen concentration and the biological oxygen demand over time and is a solution to the linear first order differential
equation [24]. This differential equation states that the total change in oxygen deficit
(D) is equal to the difference between the two rates of deoxygenating and reaeration
at any time (Fig. 3.11).
D ¼
K 1 L 1
K 2 À L 2
e
Àk1t
À e
Àk2t
À
Á þ D a e
Àk2t
ð3:17Þ
Where
D is the saturation deficit, which can be derived from the dissolved oxygen concentration at saturation minus the actual dissolved oxygen concentration (D ¼ DO sat –
DO). D has the dimensions
g
m 3
 Ã
.
K 1 is the deoxygenation rate, usually in d
À1 .
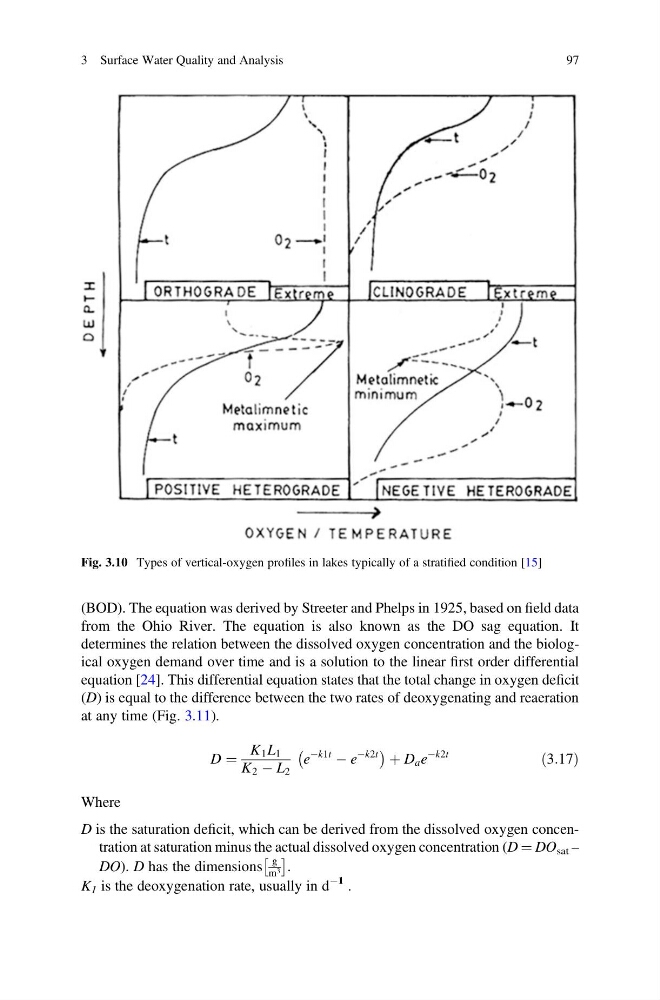
Fig. 3.10 Types of vertical-oxygen profiles in lakes typically of a stratified condition [15]
3 Surface Water Quality and Analysis
97
from the Ohio River. The equation is also known as the DO sag equation. It
determines the relation between the dissolved oxygen concentration and the biological oxygen demand over time and is a solution to the linear first order differential
equation [24]. This differential equation states that the total change in oxygen deficit
(D) is equal to the difference between the two rates of deoxygenating and reaeration
at any time (Fig. 3.11).
D ¼
K 1 L 1
K 2 À L 2
e
Àk1t
À e
Àk2t
À
Á þ D a e
Àk2t
ð3:17Þ
Where
D is the saturation deficit, which can be derived from the dissolved oxygen concentration at saturation minus the actual dissolved oxygen concentration (D ¼ DO sat –
DO). D has the dimensions
g
m 3
 Ã
.
K 1 is the deoxygenation rate, usually in d
À1 .
Fig. 3.10 Types of vertical-oxygen profiles in lakes typically of a stratified condition [15]
3 Surface Water Quality and Analysis
97