

below 2920 cm
À1 and the ν s (CH 2 ) below 2850 cm
À1 [58]. This conformation
represents a solid state of the hydrocarbon chain. A conformational disorder in a
chain is connected with the appearance of gauche conformations. It is connected
with the melting of the hydrocarbon chain and its transition to a liquid state. During
the melting process a hypsochromic shift of the methylene stretching modes is
observed. In a liquid state the ν as (CH 2 ) mode appears above 2923 cm
À1 while the
ν s (CH 2 ) above 2852 cm
À1 [60]. In the intermediate wavenumber range:
2923 < ν as (CH 2 ) < 2920 cm
À1 and 2852 < ν s (CH 2 ) < 2850 cm
À1 the hydrocarbon
chain exists in a transition state, in which predominantly all trans hydrocarbon chains
contain few gauche conformations. It is known as a gel phase of the hydrocarbon
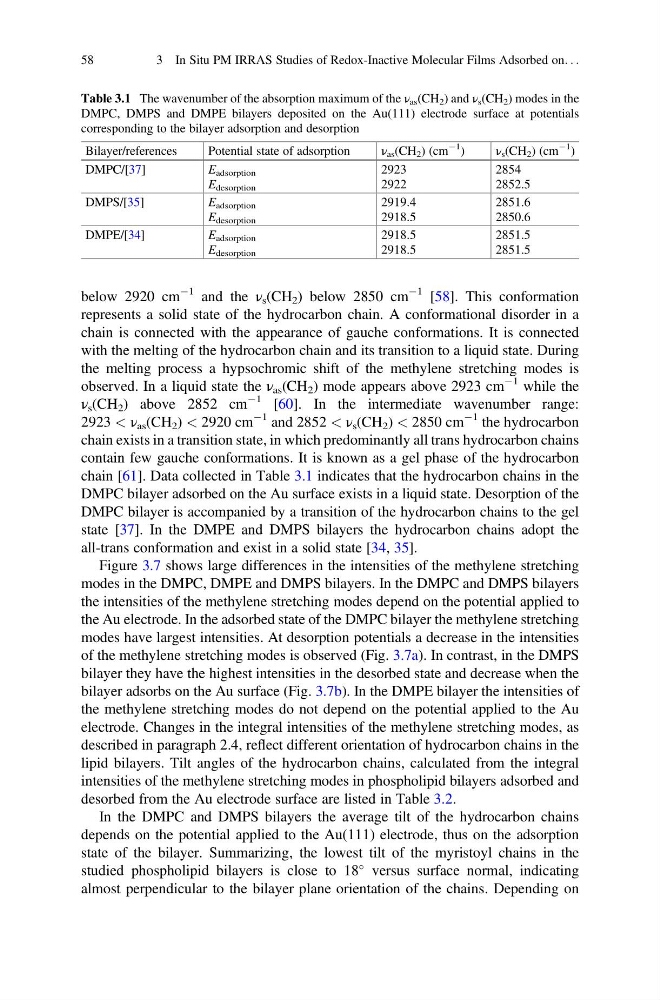
chain [61]. Data collected in Table 3.1 indicates that the hydrocarbon chains in the
DMPC bilayer adsorbed on the Au surface exists in a liquid state. Desorption of the
DMPC bilayer is accompanied by a transition of the hydrocarbon chains to the gel
state [37]. In the DMPE and DMPS bilayers the hydrocarbon chains adopt the
all-trans conformation and exist in a solid state [34, 35].
Figure 3.7 shows large differences in the intensities of the methylene stretching
modes in the DMPC, DMPE and DMPS bilayers. In the DMPC and DMPS bilayers
the intensities of the methylene stretching modes depend on the potential applied to
the Au electrode. In the adsorbed state of the DMPC bilayer the methylene stretching
modes have largest intensities. At desorption potentials a decrease in the intensities
of the methylene stretching modes is observed (Fig. 3.7a). In contrast, in the DMPS
bilayer they have the highest intensities in the desorbed state and decrease when the
bilayer adsorbs on the Au surface (Fig. 3.7b). In the DMPE bilayer the intensities of
the methylene stretching modes do not depend on the potential applied to the Au
electrode. Changes in the integral intensities of the methylene stretching modes, as
described in paragraph 2.4, reflect different orientation of hydrocarbon chains in the
lipid bilayers. Tilt angles of the hydrocarbon chains, calculated from the integral
intensities of the methylene stretching modes in phospholipid bilayers adsorbed and
desorbed from the Au electrode surface are listed in Table 3.2.
In the DMPC and DMPS bilayers the average tilt of the hydrocarbon chains
depends on the potential applied to the Au(111) electrode, thus on the adsorption
state of the bilayer. Summarizing, the lowest tilt of the myristoyl chains in the
studied phospholipid bilayers is close to 18
versus surface normal, indicating
almost perpendicular to the bilayer plane orientation of the chains. Depending on
Table 3.1 The wavenumber of the absorption maximum of the ν as (CH 2 ) and ν s (CH 2 ) modes in the
DMPC, DMPS and DMPE bilayers deposited on the Au(111) electrode surface at potentials
corresponding to the bilayer adsorption and desorption
Bilayer/references
Potential state of adsorption
ν as (CH 2 ) (cm
À1
)
ν s (CH 2 ) (cm
À1
)
DMPC/[37]
E adsorption
E desorption
2923
2922
2854
2852.5
DMPS/[35]
E adsorption
E desorption
2919.4
2918.5
2851.6
2850.6
DMPE/[34]
E adsorption
E desorption
2918.5
2918.5
2851.5
2851.5
58
3 In Situ PM IRRAS Studies of Redox-Inactive Molecular Films Adsorbed on. . .
À1 and the ν s (CH 2 ) below 2850 cm
À1 [58]. This conformation
represents a solid state of the hydrocarbon chain. A conformational disorder in a
chain is connected with the appearance of gauche conformations. It is connected
with the melting of the hydrocarbon chain and its transition to a liquid state. During
the melting process a hypsochromic shift of the methylene stretching modes is
observed. In a liquid state the ν as (CH 2 ) mode appears above 2923 cm
À1 while the
ν s (CH 2 ) above 2852 cm
À1 [60]. In the intermediate wavenumber range:
2923 < ν as (CH 2 ) < 2920 cm
À1 and 2852 < ν s (CH 2 ) < 2850 cm
À1 the hydrocarbon
chain exists in a transition state, in which predominantly all trans hydrocarbon chains
contain few gauche conformations. It is known as a gel phase of the hydrocarbon
chain [61]. Data collected in Table 3.1 indicates that the hydrocarbon chains in the
DMPC bilayer adsorbed on the Au surface exists in a liquid state. Desorption of the
DMPC bilayer is accompanied by a transition of the hydrocarbon chains to the gel
state [37]. In the DMPE and DMPS bilayers the hydrocarbon chains adopt the
all-trans conformation and exist in a solid state [34, 35].
Figure 3.7 shows large differences in the intensities of the methylene stretching
modes in the DMPC, DMPE and DMPS bilayers. In the DMPC and DMPS bilayers
the intensities of the methylene stretching modes depend on the potential applied to
the Au electrode. In the adsorbed state of the DMPC bilayer the methylene stretching
modes have largest intensities. At desorption potentials a decrease in the intensities
of the methylene stretching modes is observed (Fig. 3.7a). In contrast, in the DMPS
bilayer they have the highest intensities in the desorbed state and decrease when the
bilayer adsorbs on the Au surface (Fig. 3.7b). In the DMPE bilayer the intensities of
the methylene stretching modes do not depend on the potential applied to the Au
electrode. Changes in the integral intensities of the methylene stretching modes, as
described in paragraph 2.4, reflect different orientation of hydrocarbon chains in the
lipid bilayers. Tilt angles of the hydrocarbon chains, calculated from the integral
intensities of the methylene stretching modes in phospholipid bilayers adsorbed and
desorbed from the Au electrode surface are listed in Table 3.2.
In the DMPC and DMPS bilayers the average tilt of the hydrocarbon chains
depends on the potential applied to the Au(111) electrode, thus on the adsorption
state of the bilayer. Summarizing, the lowest tilt of the myristoyl chains in the
studied phospholipid bilayers is close to 18
versus surface normal, indicating
almost perpendicular to the bilayer plane orientation of the chains. Depending on
Table 3.1 The wavenumber of the absorption maximum of the ν as (CH 2 ) and ν s (CH 2 ) modes in the
DMPC, DMPS and DMPE bilayers deposited on the Au(111) electrode surface at potentials
corresponding to the bilayer adsorption and desorption
Bilayer/references
Potential state of adsorption
ν as (CH 2 ) (cm
À1
)
ν s (CH 2 ) (cm
À1
)
DMPC/[37]
E adsorption
E desorption
2923
2922
2854
2852.5
DMPS/[35]
E adsorption
E desorption
2919.4
2918.5
2851.6
2850.6
DMPE/[34]
E adsorption
E desorption
2918.5
2918.5
2851.5
2851.5
58
3 In Situ PM IRRAS Studies of Redox-Inactive Molecular Films Adsorbed on. . .