

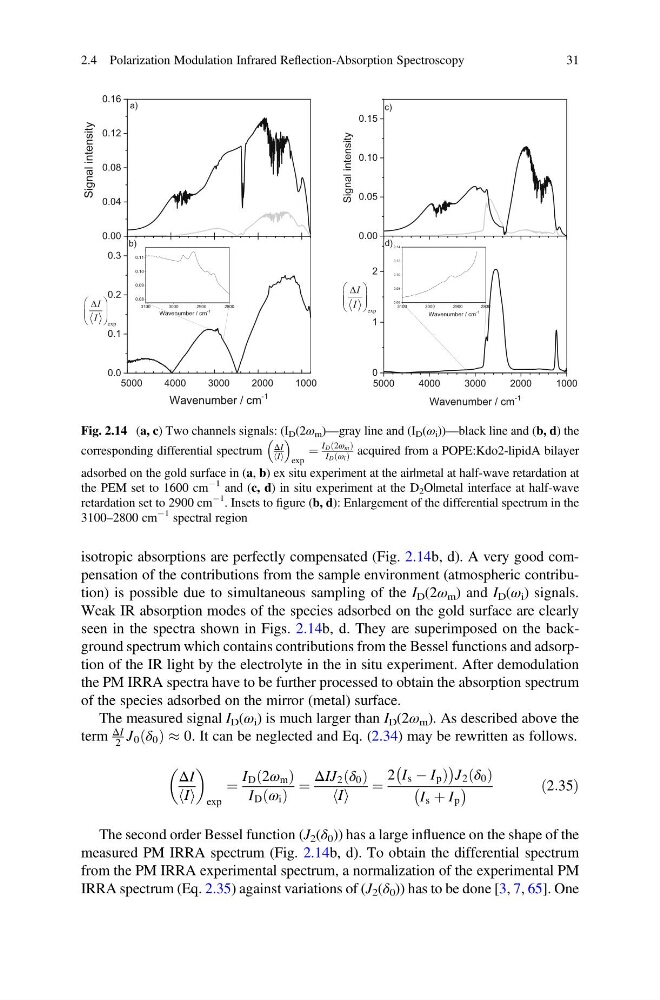
isotropic absorptions are perfectly compensated (Fig. 2.14b, d). A very good compensation of the contributions from the sample environment (atmospheric contribution) is possible due to simultaneous sampling of the I D (2ω m ) and I D (ω i ) signals.
Weak IR absorption modes of the species adsorbed on the gold surface are clearly
seen in the spectra shown in Figs. 2.14b, d. They are superimposed on the background spectrum which contains contributions from the Bessel functions and adsorption of the IR light by the electrolyte in the in situ experiment. After demodulation
the PM IRRA spectra have to be further processed to obtain the absorption spectrum
of the species adsorbed on the mirror (metal) surface.
The measured signal I D (ω i ) is much larger than I D (2ω m ). As described above the
term
ΔI
2 J 0 δ 0
ð Þ % 0. It can be neglected and Eq. (2.34) may be rewritten as follows.
ΔI
I
h i
exp
¼
I D 2ω m
ð
Þ
I D ω i
ð Þ
¼
ΔIJ 2 δ 0
ð Þ
I
h i
¼
2 I s À I p Þ
À
Á
J 2 δ 0
ð Þ
I s þ I p
À
Á
ð2:35Þ
The second order Bessel function (J 2 (δ 0 )) has a large influence on the shape of the
measured PM IRRA spectrum (Fig. 2.14b, d). To obtain the differential spectrum
from the PM IRRA experimental spectrum, a normalization of the experimental PM
IRRA spectrum (Eq. 2.35) against variations of (J 2 (δ 0 )) has to be done [3, 7, 65]. One
5000
4000
3000
2000
1000
0.0
0.1
0.2
0.3
0.00
0.04
0.08
0.12
0.16
3100
3000
2900
2800
0.08
0.09
0.10
0.11
Wavenumber / cm
-1
b)
a)
Signal intensity
Wavenumber / cm -1
0.00
0.05
0.10
0.15
5000
4000
3000
2000
1000
0
1
2
3100
3000
2900
2800
0.06
0.08
0.10
0.12
0.14
d)
c)
Signal intensity
Wavenumber / cm
-1
Wavenumber / cm -1
Fig. 2.14 (a, c) Two channels signals: (I D (2ω m )—gray line and (I D (ω i ))—black line and (b, d) the
corresponding differential spectrum
ΔI
I
h i
exp
¼
ID 2ωm
ð
Þ
ID ωi
ð Þ acquired from a POPE:Kdo2-lipidA bilayer
adsorbed on the gold surface in (a, b) ex situ experiment at the air|metal at half-wave retardation at
the PEM set to 1600 cm
À1 and (c, d) in situ experiment at the D 2 O|metal interface at half-wave
retardation set to 2900 cm
À1
. Insets to figure (b, d): Enlargement of the differential spectrum in the
3100–2800 cm
À1 spectral region
2.4 Polarization Modulation Infrared Reflection-Absorption Spectroscopy
31
Weak IR absorption modes of the species adsorbed on the gold surface are clearly
seen in the spectra shown in Figs. 2.14b, d. They are superimposed on the background spectrum which contains contributions from the Bessel functions and adsorption of the IR light by the electrolyte in the in situ experiment. After demodulation
the PM IRRA spectra have to be further processed to obtain the absorption spectrum
of the species adsorbed on the mirror (metal) surface.
The measured signal I D (ω i ) is much larger than I D (2ω m ). As described above the
term
ΔI
2 J 0 δ 0
ð Þ % 0. It can be neglected and Eq. (2.34) may be rewritten as follows.
ΔI
I
h i
exp
¼
I D 2ω m
ð
Þ
I D ω i
ð Þ
¼
ΔIJ 2 δ 0
ð Þ
I
h i
¼
2 I s À I p Þ
À
Á
J 2 δ 0
ð Þ
I s þ I p
À
Á
ð2:35Þ
The second order Bessel function (J 2 (δ 0 )) has a large influence on the shape of the
measured PM IRRA spectrum (Fig. 2.14b, d). To obtain the differential spectrum
from the PM IRRA experimental spectrum, a normalization of the experimental PM
IRRA spectrum (Eq. 2.35) against variations of (J 2 (δ 0 )) has to be done [3, 7, 65]. One
5000
4000
3000
2000
1000
0.0
0.1
0.2
0.3
0.00
0.04
0.08
0.12
0.16
3100
3000
2900
2800
0.08
0.09
0.10
0.11
Wavenumber / cm
-1
b)
a)
Signal intensity
Wavenumber / cm -1
0.00
0.05
0.10
0.15
5000
4000
3000
2000
1000
0
1
2
3100
3000
2900
2800
0.06
0.08
0.10
0.12
0.14
d)
c)
Signal intensity
Wavenumber / cm
-1
Wavenumber / cm -1
Fig. 2.14 (a, c) Two channels signals: (I D (2ω m )—gray line and (I D (ω i ))—black line and (b, d) the
corresponding differential spectrum
ΔI
I
h i
exp
¼
ID 2ωm
ð
Þ
ID ωi
ð Þ acquired from a POPE:Kdo2-lipidA bilayer
adsorbed on the gold surface in (a, b) ex situ experiment at the air|metal at half-wave retardation at
the PEM set to 1600 cm
À1 and (c, d) in situ experiment at the D 2 O|metal interface at half-wave
retardation set to 2900 cm
À1
. Insets to figure (b, d): Enlargement of the differential spectrum in the
3100–2800 cm
À1 spectral region
2.4 Polarization Modulation Infrared Reflection-Absorption Spectroscopy
31