

signals (ΔI and hIi) are analyzed separately. The surface reflectivity factor
(R.F. surface ) and bulk reflectivity factor (R.F. bulk ) are calculated [19].
R:F:surface ¼
ΔI
ð Þ sample
ΔI
ð Þ reference
À 1
ð4:7Þ
R:F:bulk ¼
I
h i
ð Þ sample
I
h i
ð Þ reference
À 1
ð4:8Þ
The R.F. surface and R.F. bulk provide differential spectra due to electric potential
dependent changes in both the thick film present on the electrode surface and in the
bulk phase, respectively.
The mechanism of the electro-oxidation reaction of ethanol depends on the
material of the catalyst and on the pH of the electrolyte solution. Despite numerous
studies the mechanism of this reaction is not well recognized [18, 28]. Pd surface is
an important catalyst for the electrooxidation of ethanol in alkaline solutions. Pd
nanoparticles (NPs) were deposited on the GCE surface to identify the products of
the oxidation reaction which remain adsorbed in the surface and diffuse in the
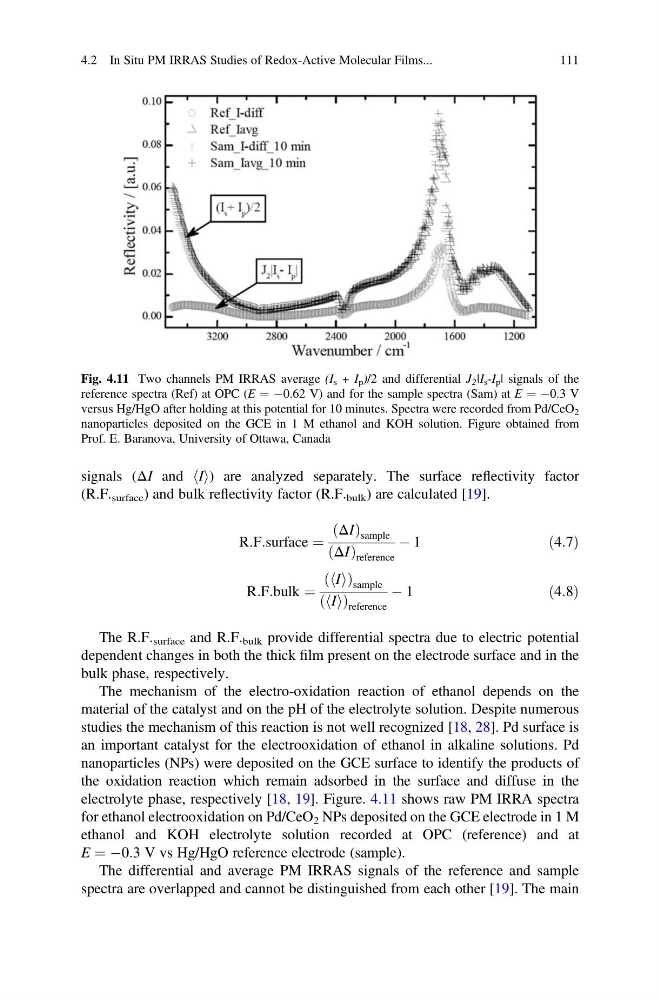
electrolyte phase, respectively [18, 19]. Figure. 4.11 shows raw PM IRRA spectra
for ethanol electrooxidation on Pd/CeO 2 NPs deposited on the GCE electrode in 1 M
ethanol and KOH electrolyte solution recorded at OPC (reference) and at
E ¼ À0.3 V vs Hg/HgO reference electrode (sample).
The differential and average PM IRRAS signals of the reference and sample
spectra are overlapped and cannot be distinguished from each other [19]. The main
Fig. 4.11 Two channels PM IRRAS average (I s + I p )/2 and differential J 2 |I s -I p | signals of the
reference spectra (Ref) at OPC (E ¼ À0.62 V) and for the sample spectra (Sam) at E ¼ À0.3 V
versus Hg/HgO after holding at this potential for 10 minutes. Spectra were recorded from Pd/CeO 2
nanoparticles deposited on the GCE in 1 M ethanol and KOH solution. Figure obtained from
Prof. E. Baranova, University of Ottawa, Canada
4.2 In Situ PM IRRAS Studies of Redox-Active Molecular Films...
111
(R.F. surface ) and bulk reflectivity factor (R.F. bulk ) are calculated [19].
R:F:surface ¼
ΔI
ð Þ sample
ΔI
ð Þ reference
À 1
ð4:7Þ
R:F:bulk ¼
I
h i
ð Þ sample
I
h i
ð Þ reference
À 1
ð4:8Þ
The R.F. surface and R.F. bulk provide differential spectra due to electric potential
dependent changes in both the thick film present on the electrode surface and in the
bulk phase, respectively.
The mechanism of the electro-oxidation reaction of ethanol depends on the
material of the catalyst and on the pH of the electrolyte solution. Despite numerous
studies the mechanism of this reaction is not well recognized [18, 28]. Pd surface is
an important catalyst for the electrooxidation of ethanol in alkaline solutions. Pd
nanoparticles (NPs) were deposited on the GCE surface to identify the products of
the oxidation reaction which remain adsorbed in the surface and diffuse in the
electrolyte phase, respectively [18, 19]. Figure. 4.11 shows raw PM IRRA spectra
for ethanol electrooxidation on Pd/CeO 2 NPs deposited on the GCE electrode in 1 M
ethanol and KOH electrolyte solution recorded at OPC (reference) and at
E ¼ À0.3 V vs Hg/HgO reference electrode (sample).
The differential and average PM IRRAS signals of the reference and sample
spectra are overlapped and cannot be distinguished from each other [19]. The main
Fig. 4.11 Two channels PM IRRAS average (I s + I p )/2 and differential J 2 |I s -I p | signals of the
reference spectra (Ref) at OPC (E ¼ À0.62 V) and for the sample spectra (Sam) at E ¼ À0.3 V
versus Hg/HgO after holding at this potential for 10 minutes. Spectra were recorded from Pd/CeO 2
nanoparticles deposited on the GCE in 1 M ethanol and KOH solution. Figure obtained from
Prof. E. Baranova, University of Ottawa, Canada
4.2 In Situ PM IRRAS Studies of Redox-Active Molecular Films...
111