

3 Disruptive Mobility in Pre- and Post-COVID Times …
79
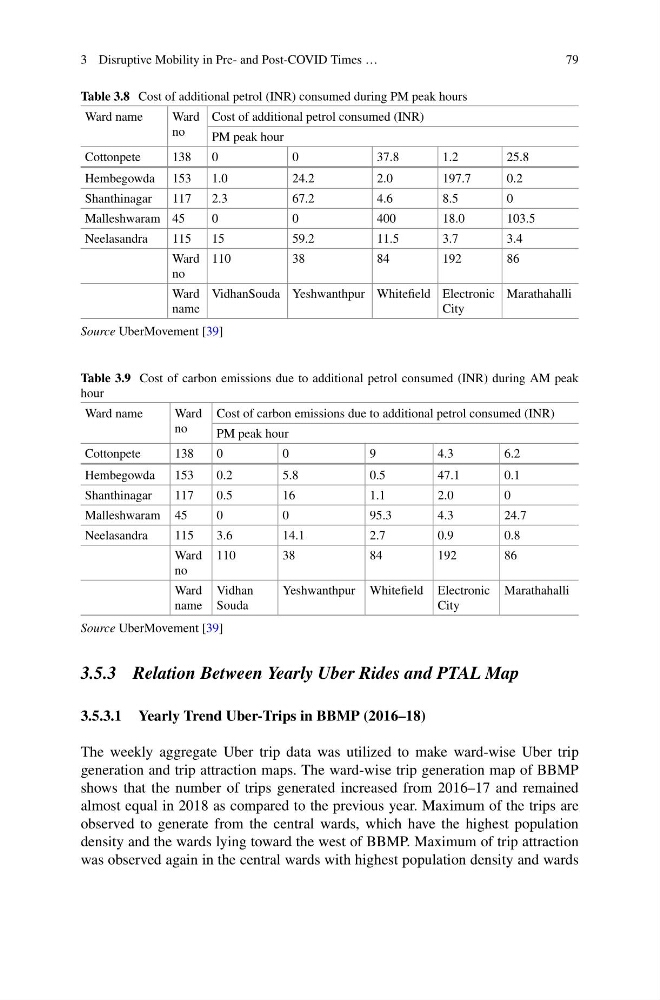
Table 3.8 Cost of additional petrol (INR) consumed during PM peak hours
Ward name
Ward
no
Cost of additional petrol consumed (INR)
PM peak hour
Cottonpete
138
0
0
37.8
1.2
25.8
Hembegowda 153
1.0
24.2
2.0
197.7
0.2
Shanthinagar
117
2.3
67.2
4.6
8.5
0
Malleshwaram 45
0
0
400
18.0
103.5
Neelasandra
115
15
59.2
11.5
3.7
3.4
Ward
no
110
38
84
192
86
Ward
name
VidhanSouda Yeshwanthpur Whitefield Electronic
City
Marathahalli
Source UberMovement [39]
Table 3.9 Cost of carbon emissions due to additional petrol consumed (INR) during AM peak
hour
Ward name
Ward
no
Cost of carbon emissions due to additional petrol consumed (INR)
PM peak hour
Cottonpete
138
0
0
9
4.3
6.2
Hembegowda
153
0.2
5.8
0.5
47.1
0.1
Shanthinagar
117
0.5
16
1.1
2.0
0
Malleshwaram 45
0
0
95.3
4.3
24.7
Neelasandra
115
3.6
14.1
2.7
0.9
0.8
Ward
no
110
38
84
192
86
Ward
name
Vidhan
Souda
Yeshwanthpur Whitefield Electronic
City
Marathahalli
Source UberMovement [39]
3.5.3 Relation Between Yearly Uber Rides and PTAL Map
3.5.3.1 Yearly Trend Uber-Trips in BBMP (2016–18)
The weekly aggregate Uber trip data was utilized to make ward-wise Uber trip
generation and trip attraction maps. The ward-wise trip generation map of BBMP
shows that the number of trips generated increased from 2016–17 and remained
almost equal in 2018 as compared to the previous year. Maximum of the trips are
observed to generate from the central wards, which have the highest population
density and the wards lying toward the west of BBMP. Maximum of trip attraction
was observed again in the central wards with highest population density and wards
79
Table 3.8 Cost of additional petrol (INR) consumed during PM peak hours
Ward name
Ward
no
Cost of additional petrol consumed (INR)
PM peak hour
Cottonpete
138
0
0
37.8
1.2
25.8
Hembegowda 153
1.0
24.2
2.0
197.7
0.2
Shanthinagar
117
2.3
67.2
4.6
8.5
0
Malleshwaram 45
0
0
400
18.0
103.5
Neelasandra
115
15
59.2
11.5
3.7
3.4
Ward
no
110
38
84
192
86
Ward
name
VidhanSouda Yeshwanthpur Whitefield Electronic
City
Marathahalli
Source UberMovement [39]
Table 3.9 Cost of carbon emissions due to additional petrol consumed (INR) during AM peak
hour
Ward name
Ward
no
Cost of carbon emissions due to additional petrol consumed (INR)
PM peak hour
Cottonpete
138
0
0
9
4.3
6.2
Hembegowda
153
0.2
5.8
0.5
47.1
0.1
Shanthinagar
117
0.5
16
1.1
2.0
0
Malleshwaram 45
0
0
95.3
4.3
24.7
Neelasandra
115
3.6
14.1
2.7
0.9
0.8
Ward
no
110
38
84
192
86
Ward
name
Vidhan
Souda
Yeshwanthpur Whitefield Electronic
City
Marathahalli
Source UberMovement [39]
3.5.3 Relation Between Yearly Uber Rides and PTAL Map
3.5.3.1 Yearly Trend Uber-Trips in BBMP (2016–18)
The weekly aggregate Uber trip data was utilized to make ward-wise Uber trip
generation and trip attraction maps. The ward-wise trip generation map of BBMP
shows that the number of trips generated increased from 2016–17 and remained
almost equal in 2018 as compared to the previous year. Maximum of the trips are
observed to generate from the central wards, which have the highest population
density and the wards lying toward the west of BBMP. Maximum of trip attraction
was observed again in the central wards with highest population density and wards