

3 Disruptive Mobility in Pre- and Post-COVID Times …
67
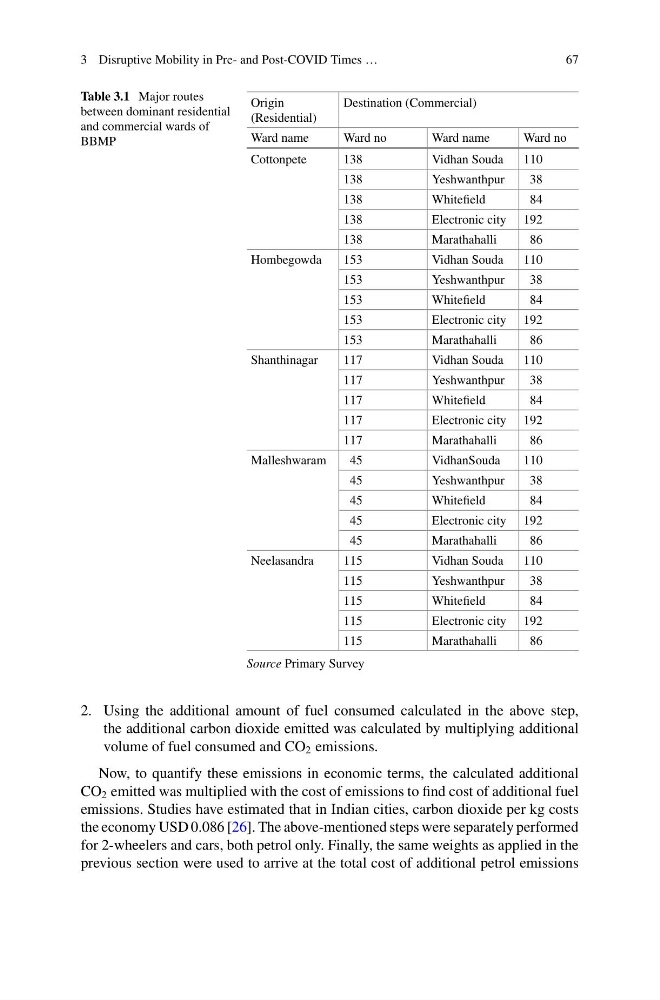
Table 3.1 Major routes
between dominant residential
and commercial wards of
BBMP
Origin
(Residential)
Destination (Commercial)
Ward name
Ward no
Ward name
Ward no
Cottonpete
138
Vidhan Souda
110
138
Yeshwanthpur
38
138
Whitefield
84
138
Electronic city 192
138
Marathahalli
86
Hombegowda
153
Vidhan Souda
110
153
Yeshwanthpur
38
153
Whitefield
84
153
Electronic city 192
153
Marathahalli
86
Shanthinagar
117
Vidhan Souda
110
117
Yeshwanthpur
38
117
Whitefield
84
117
Electronic city 192
117
Marathahalli
86
Malleshwaram
45
VidhanSouda
110
45
Yeshwanthpur
38
45
Whitefield
84
45
Electronic city 192
45
Marathahalli
86
Neelasandra
115
Vidhan Souda
110
115
Yeshwanthpur
38
115
Whitefield
84
115
Electronic city 192
115
Marathahalli
86
Source Primary Survey
2. Using the additional amount of fuel consumed calculated in the above step,
the additional carbon dioxide emitted was calculated by multiplying additional
volume of fuel consumed and CO 2 emissions.
Now, to quantify these emissions in economic terms, the calculated additional
CO 2 emitted was multiplied with the cost of emissions to find cost of additional fuel
emissions. Studies have estimated that in Indian cities, carbon dioxide per kg costs
the economy USD 0.086 [26]. The above-mentioned steps were separately performed
for 2-wheelers and cars, both petrol only. Finally, the same weights as applied in the
previous section were used to arrive at the total cost of additional petrol emissions
67
Table 3.1 Major routes
between dominant residential
and commercial wards of
BBMP
Origin
(Residential)
Destination (Commercial)
Ward name
Ward no
Ward name
Ward no
Cottonpete
138
Vidhan Souda
110
138
Yeshwanthpur
38
138
Whitefield
84
138
Electronic city 192
138
Marathahalli
86
Hombegowda
153
Vidhan Souda
110
153
Yeshwanthpur
38
153
Whitefield
84
153
Electronic city 192
153
Marathahalli
86
Shanthinagar
117
Vidhan Souda
110
117
Yeshwanthpur
38
117
Whitefield
84
117
Electronic city 192
117
Marathahalli
86
Malleshwaram
45
VidhanSouda
110
45
Yeshwanthpur
38
45
Whitefield
84
45
Electronic city 192
45
Marathahalli
86
Neelasandra
115
Vidhan Souda
110
115
Yeshwanthpur
38
115
Whitefield
84
115
Electronic city 192
115
Marathahalli
86
Source Primary Survey
2. Using the additional amount of fuel consumed calculated in the above step,
the additional carbon dioxide emitted was calculated by multiplying additional
volume of fuel consumed and CO 2 emissions.
Now, to quantify these emissions in economic terms, the calculated additional
CO 2 emitted was multiplied with the cost of emissions to find cost of additional fuel
emissions. Studies have estimated that in Indian cities, carbon dioxide per kg costs
the economy USD 0.086 [26]. The above-mentioned steps were separately performed
for 2-wheelers and cars, both petrol only. Finally, the same weights as applied in the
previous section were used to arrive at the total cost of additional petrol emissions