

1 COVID-19: An Opportunity for Smart and Sustainable …
19
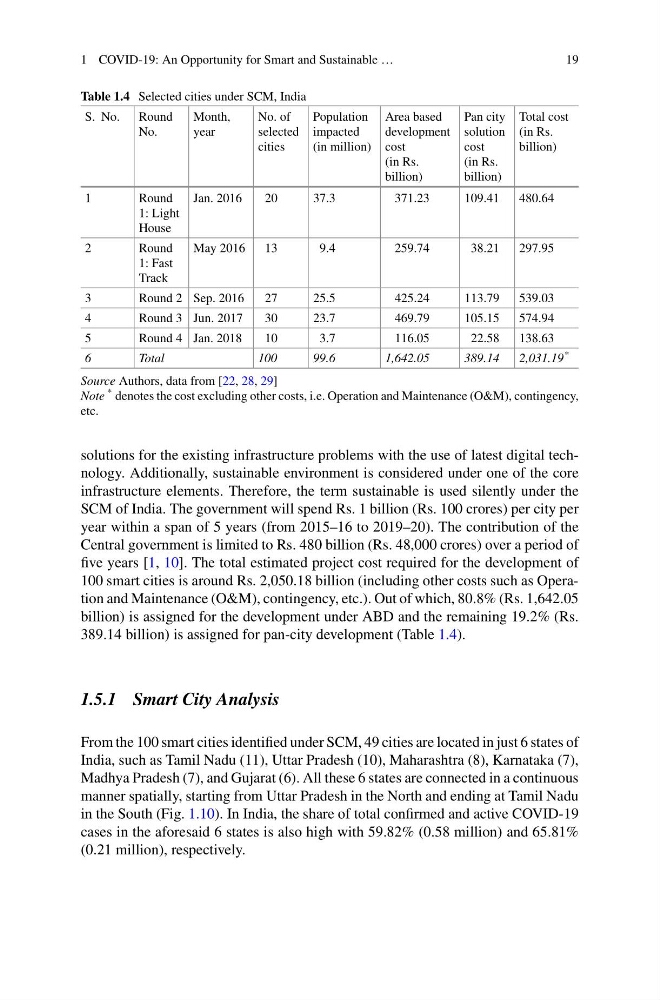
Table 1.4 Selected cities under SCM, India
S. No. Round
No.
Month,
year
No. of
selected
cities
Population
impacted
(in million)
Area based
development
cost
(in Rs.
billion)
Pan city
solution
cost
(in Rs.
billion)
Total cost
(in Rs.
billion)
1
Round
1: Light
House
Jan. 2016
20
37.3
371.23
109.41
480.64
2
Round
1: Fast
Track
May 2016
13
9.4
259.74
38.21
297.95
3
Round 2 Sep. 2016
27
25.5
425.24
113.79
539.03
4
Round 3 Jun. 2017
30
23.7
469.79
105.15
574.94
5
Round 4 Jan. 2018
10
3.7
116.05
22.58
138.63
6
Total
100
99.6
1,642.05
389.14
2,031.19 *
Source Authors, data from [22, 28, 29]
Note * denotes the cost excluding other costs, i.e. Operation and Maintenance (O&M), contingency,
etc.
solutions for the existing infrastructure problems with the use of latest digital technology. Additionally, sustainable environment is considered under one of the core
infrastructure elements. Therefore, the term sustainable is used silently under the
SCM of India. The government will spend Rs. 1 billion (Rs. 100 crores) per city per
year within a span of 5 years (from 2015–16 to 2019–20). The contribution of the
Central government is limited to Rs. 480 billion (Rs. 48,000 crores) over a period of
five years [1, 10]. The total estimated project cost required for the development of
100 smart cities is around Rs. 2,050.18 billion (including other costs such as Operation and Maintenance (O&M), contingency, etc.). Out of which, 80.8% (Rs. 1,642.05
billion) is assigned for the development under ABD and the remaining 19.2% (Rs.
389.14 billion) is assigned for pan-city development (Table 1.4).
1.5.1 Smart City Analysis
From the 100 smart cities identified under SCM, 49 cities are located in just 6 states of
India, such as Tamil Nadu (11), Uttar Pradesh (10), Maharashtra (8), Karnataka (7),
Madhya Pradesh (7), and Gujarat (6). All these 6 states are connected in a continuous
manner spatially, starting from Uttar Pradesh in the North and ending at Tamil Nadu
in the South (Fig. 1.10). In India, the share of total confirmed and active COVID-19
cases in the aforesaid 6 states is also high with 59.82% (0.58 million) and 65.81%
(0.21 million), respectively.
19
Table 1.4 Selected cities under SCM, India
S. No. Round
No.
Month,
year
No. of
selected
cities
Population
impacted
(in million)
Area based
development
cost
(in Rs.
billion)
Pan city
solution
cost
(in Rs.
billion)
Total cost
(in Rs.
billion)
1
Round
1: Light
House
Jan. 2016
20
37.3
371.23
109.41
480.64
2
Round
1: Fast
Track
May 2016
13
9.4
259.74
38.21
297.95
3
Round 2 Sep. 2016
27
25.5
425.24
113.79
539.03
4
Round 3 Jun. 2017
30
23.7
469.79
105.15
574.94
5
Round 4 Jan. 2018
10
3.7
116.05
22.58
138.63
6
Total
100
99.6
1,642.05
389.14
2,031.19 *
Source Authors, data from [22, 28, 29]
Note * denotes the cost excluding other costs, i.e. Operation and Maintenance (O&M), contingency,
etc.
solutions for the existing infrastructure problems with the use of latest digital technology. Additionally, sustainable environment is considered under one of the core
infrastructure elements. Therefore, the term sustainable is used silently under the
SCM of India. The government will spend Rs. 1 billion (Rs. 100 crores) per city per
year within a span of 5 years (from 2015–16 to 2019–20). The contribution of the
Central government is limited to Rs. 480 billion (Rs. 48,000 crores) over a period of
five years [1, 10]. The total estimated project cost required for the development of
100 smart cities is around Rs. 2,050.18 billion (including other costs such as Operation and Maintenance (O&M), contingency, etc.). Out of which, 80.8% (Rs. 1,642.05
billion) is assigned for the development under ABD and the remaining 19.2% (Rs.
389.14 billion) is assigned for pan-city development (Table 1.4).
1.5.1 Smart City Analysis
From the 100 smart cities identified under SCM, 49 cities are located in just 6 states of
India, such as Tamil Nadu (11), Uttar Pradesh (10), Maharashtra (8), Karnataka (7),
Madhya Pradesh (7), and Gujarat (6). All these 6 states are connected in a continuous
manner spatially, starting from Uttar Pradesh in the North and ending at Tamil Nadu
in the South (Fig. 1.10). In India, the share of total confirmed and active COVID-19
cases in the aforesaid 6 states is also high with 59.82% (0.58 million) and 65.81%
(0.21 million), respectively.