

5 The Dual Impact of Lockdown on Curbing COVID-19 Spread …
127
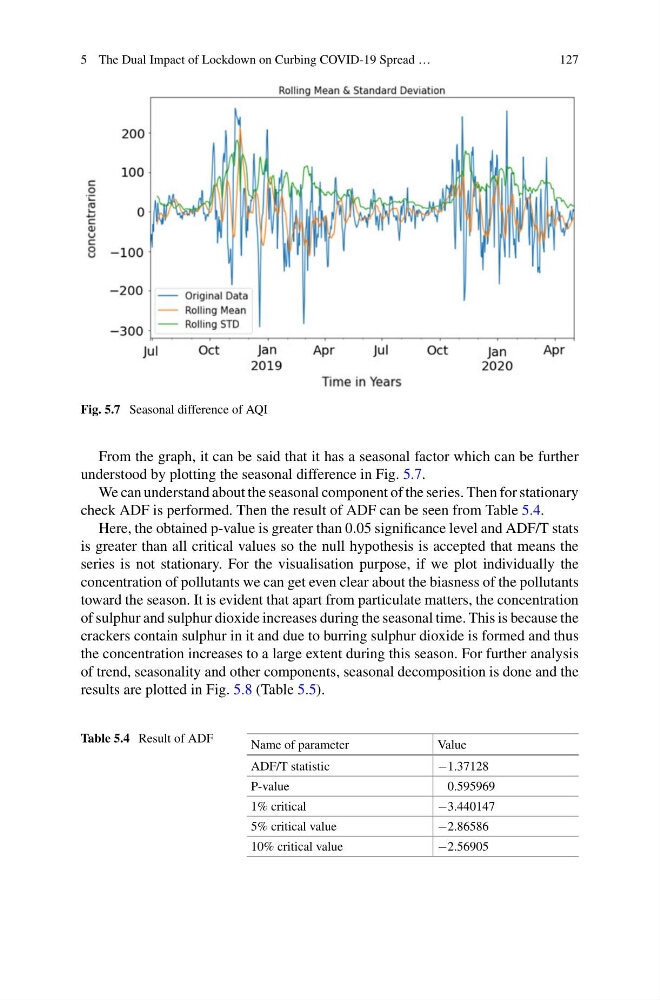
Fig. 5.7 Seasonal difference of AQI
From the graph, it can be said that it has a seasonal factor which can be further
understood by plotting the seasonal difference in Fig. 5.7.
We can understand about the seasonal component of the series. Then for stationary
check ADF is performed. Then the result of ADF can be seen from Table 5.4.
Here, the obtained p-value is greater than 0.05 significance level and ADF/T stats
is greater than all critical values so the null hypothesis is accepted that means the
series is not stationary. For the visualisation purpose, if we plot individually the
concentration of pollutants we can get even clear about the biasness of the pollutants
toward the season. It is evident that apart from particulate matters, the concentration
of sulphur and sulphur dioxide increases during the seasonal time. This is because the
crackers contain sulphur in it and due to burring sulphur dioxide is formed and thus
the concentration increases to a large extent during this season. For further analysis
of trend, seasonality and other components, seasonal decomposition is done and the
results are plotted in Fig. 5.8 (Table 5.5).
Table 5.4 Result of ADF
Name of parameter
Value
ADF/T statistic
−1.37128
P-value
0.595969
1% critical
−3.440147
5% critical value
−2.86586
10% critical value
−2.56905
127
Fig. 5.7 Seasonal difference of AQI
From the graph, it can be said that it has a seasonal factor which can be further
understood by plotting the seasonal difference in Fig. 5.7.
We can understand about the seasonal component of the series. Then for stationary
check ADF is performed. Then the result of ADF can be seen from Table 5.4.
Here, the obtained p-value is greater than 0.05 significance level and ADF/T stats
is greater than all critical values so the null hypothesis is accepted that means the
series is not stationary. For the visualisation purpose, if we plot individually the
concentration of pollutants we can get even clear about the biasness of the pollutants
toward the season. It is evident that apart from particulate matters, the concentration
of sulphur and sulphur dioxide increases during the seasonal time. This is because the
crackers contain sulphur in it and due to burring sulphur dioxide is formed and thus
the concentration increases to a large extent during this season. For further analysis
of trend, seasonality and other components, seasonal decomposition is done and the
results are plotted in Fig. 5.8 (Table 5.5).
Table 5.4 Result of ADF
Name of parameter
Value
ADF/T statistic
−1.37128
P-value
0.595969
1% critical
−3.440147
5% critical value
−2.86586
10% critical value
−2.56905