

118
S. Roy and A. Chatterjee
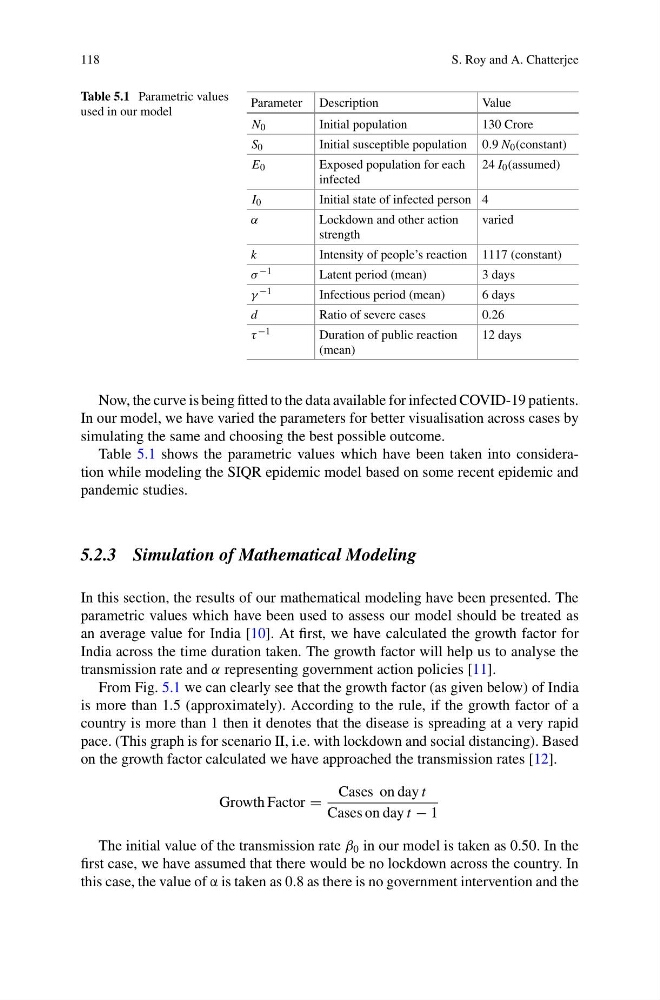
Table 5.1 Parametric values
used in our model
Parameter Description
Value
N 0
Initial population
130 Crore
S 0
Initial susceptible population 0.9 N 0 (constant)
E 0
Exposed population for each
infected
24 I 0 (assumed)
I 0
Initial state of infected person 4
α
Lockdown and other action
strength
varied
k
Intensity of people’s reaction 1117 (constant)
σ −1
Latent period (mean)
3 days
γ −1
Infectious period (mean)
6 days
d
Ratio of severe cases
0.26
τ −1
Duration of public reaction
(mean)
12 days
Now, the curve is being fitted to the data available for infected COVID-19 patients.
In our model, we have varied the parameters for better visualisation across cases by
simulating the same and choosing the best possible outcome.
Table 5.1 shows the parametric values which have been taken into consideration while modeling the SIQR epidemic model based on some recent epidemic and
pandemic studies.
5.2.3 Simulation of Mathematical Modeling
In this section, the results of our mathematical modeling have been presented. The
parametric values which have been used to assess our model should be treated as
an average value for India [10]. At first, we have calculated the growth factor for
India across the time duration taken. The growth factor will help us to analyse the
transmission rate and α representing government action policies [11].
From Fig. 5.1 we can clearly see that the growth factor (as given below) of India
is more than 1.5 (approximately). According to the rule, if the growth factor of a
country is more than 1 then it denotes that the disease is spreading at a very rapid
pace. (This graph is for scenario II, i.e. with lockdown and social distancing). Based
on the growth factor calculated we have approached the transmission rates [12].
Growth Factor =
Cases on day t
Cases on day t − 1
The initial value of the transmission rate β 0 in our model is taken as 0.50. In the
first case, we have assumed that there would be no lockdown across the country. In
this case, the value of α is taken as 0.8 as there is no government intervention and the
S. Roy and A. Chatterjee
Table 5.1 Parametric values
used in our model
Parameter Description
Value
N 0
Initial population
130 Crore
S 0
Initial susceptible population 0.9 N 0 (constant)
E 0
Exposed population for each
infected
24 I 0 (assumed)
I 0
Initial state of infected person 4
α
Lockdown and other action
strength
varied
k
Intensity of people’s reaction 1117 (constant)
σ −1
Latent period (mean)
3 days
γ −1
Infectious period (mean)
6 days
d
Ratio of severe cases
0.26
τ −1
Duration of public reaction
(mean)
12 days
Now, the curve is being fitted to the data available for infected COVID-19 patients.
In our model, we have varied the parameters for better visualisation across cases by
simulating the same and choosing the best possible outcome.
Table 5.1 shows the parametric values which have been taken into consideration while modeling the SIQR epidemic model based on some recent epidemic and
pandemic studies.
5.2.3 Simulation of Mathematical Modeling
In this section, the results of our mathematical modeling have been presented. The
parametric values which have been used to assess our model should be treated as
an average value for India [10]. At first, we have calculated the growth factor for
India across the time duration taken. The growth factor will help us to analyse the
transmission rate and α representing government action policies [11].
From Fig. 5.1 we can clearly see that the growth factor (as given below) of India
is more than 1.5 (approximately). According to the rule, if the growth factor of a
country is more than 1 then it denotes that the disease is spreading at a very rapid
pace. (This graph is for scenario II, i.e. with lockdown and social distancing). Based
on the growth factor calculated we have approached the transmission rates [12].
Growth Factor =
Cases on day t
Cases on day t − 1
The initial value of the transmission rate β 0 in our model is taken as 0.50. In the
first case, we have assumed that there would be no lockdown across the country. In
this case, the value of α is taken as 0.8 as there is no government intervention and the