

116
S. Roy and A. Chatterjee
5.2.1 Theoretical Framework
In this section, we propose our dynamic model to predict the spread of COVID-19
across the nation. The spread of this virus is following an exponential growth rate
path, creating a massacre around the globe. The aim of this section is to forecast the
path of daily infected cases and to measure the extent of the epidemic in India [5].
In this paper, we use Susceptible-Infectious-Quarantine-Recovered (SIQR)
model. In this model, we divide our entire population of 130 crores in India into
four categories or sub-parts. The entire population is assumed to be N and it has
been normalised to one for better assessment. The different categories in which we
have divided are as follows—Susceptible S, Infectious I, Quarantine Q, Removed
(either recovered or deceased). The total number of active cases is being denoted by
C, and it’s the sum of Infectious and Removed, i.e. C = I + R [6].
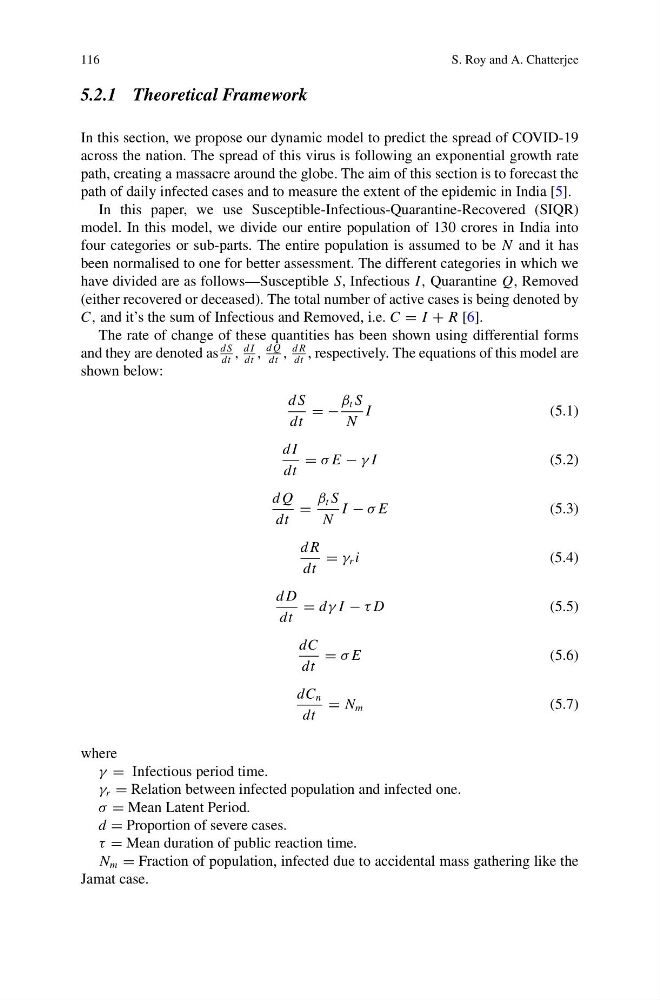
The rate of change of these quantities has been shown using differential forms
and they are denoted as
d S
dt
,
d I
dt
,
d Q
dt
,
d R
dt
, respectively. The equations of this model are
shown below:
d S
dt
= −
β t S
N
I
(5.1)
d I
dt
= σ E − γ I
(5.2)
d Q
dt
=
β t S
N
I − σ E
(5.3)
d R
dt
= γ r i
(5.4)
d D
dt
= dγ I − τ D
(5.5)
dC
dt
= σ E
(5.6)
dC n
dt
= N m
(5.7)
where
γ = Infectious period time.
γ r = Relation between infected population and infected one.
σ = Mean Latent Period.
d = Proportion of severe cases.
τ = Mean duration of public reaction time.
N m = Fraction of population, infected due to accidental mass gathering like the
Jamat case.
S. Roy and A. Chatterjee
5.2.1 Theoretical Framework
In this section, we propose our dynamic model to predict the spread of COVID-19
across the nation. The spread of this virus is following an exponential growth rate
path, creating a massacre around the globe. The aim of this section is to forecast the
path of daily infected cases and to measure the extent of the epidemic in India [5].
In this paper, we use Susceptible-Infectious-Quarantine-Recovered (SIQR)
model. In this model, we divide our entire population of 130 crores in India into
four categories or sub-parts. The entire population is assumed to be N and it has
been normalised to one for better assessment. The different categories in which we
have divided are as follows—Susceptible S, Infectious I, Quarantine Q, Removed
(either recovered or deceased). The total number of active cases is being denoted by
C, and it’s the sum of Infectious and Removed, i.e. C = I + R [6].
The rate of change of these quantities has been shown using differential forms
and they are denoted as
d S
dt
,
d I
dt
,
d Q
dt
,
d R
dt
, respectively. The equations of this model are
shown below:
d S
dt
= −
β t S
N
I
(5.1)
d I
dt
= σ E − γ I
(5.2)
d Q
dt
=
β t S
N
I − σ E
(5.3)
d R
dt
= γ r i
(5.4)
d D
dt
= dγ I − τ D
(5.5)
dC
dt
= σ E
(5.6)
dC n
dt
= N m
(5.7)
where
γ = Infectious period time.
γ r = Relation between infected population and infected one.
σ = Mean Latent Period.
d = Proportion of severe cases.
τ = Mean duration of public reaction time.
N m = Fraction of population, infected due to accidental mass gathering like the
Jamat case.