

normalized by dividing the normalized lipid concentration
either with dry weight or the protein content of the sample.
10. If a more accurate quantitation of selected lipids is needed,
standard curves should be used for quantification. If other
reference compounds are not available, the standard curves
are prepared using PC (16:1/0:0-D 3 ), PC(16:1/16:1-D 6 ),
and TAG(16:0/16:0/16:013 C3) and, as in the samples, standard mixture 1 as internal standard. Thereafter, the curves of
PC (16:1/0:0-D 3 ), PC(16:1/16:1-D 6 ), and TAG(16:0/
16:0/16:013
C3) are used for quantitation of lysolipids, phospholipids, and triacylglycerols, respectively. An instrument vendor’s software is used for quantitation. The linear range of the
method is different for each lipid class and depends on the MS
instrument used.
3.3 Lipidomics
Profiling Platform for
Lipid Identification
(UPLC-MS/MS)
1. Chromatographic separation is carried out as described above
(Sect. 3.2).
2. MS
n fragmentation is performed on a LTQ-Orbitrap mass
spectrometer using electrospray ionization in positive or negative ion mode.
3. Calibrate the instrument externally according to the instructions of the manufacturer.
4. Acquire MS/MS (or MS
2 and MS
3
) data using either high
resolution up to target mass resolution R ¼ 15,000–30,000
300
100
400
500
600
m/z
700
800
900
1000
929.5238
767.4708
681.3460
651.2990
519.2929
489.2459
- Gal & C18:3
- C18:3
- Gal & C16:4
- C16:4
- Galactose
[M+Na] +
405.1368
T: FTMS + p ESI Full ms2 929.52@hcd40.00 [200.00-1000.00]
90
80
70
60
50
Relative Abundance
40
30
20
10
0
347.0950
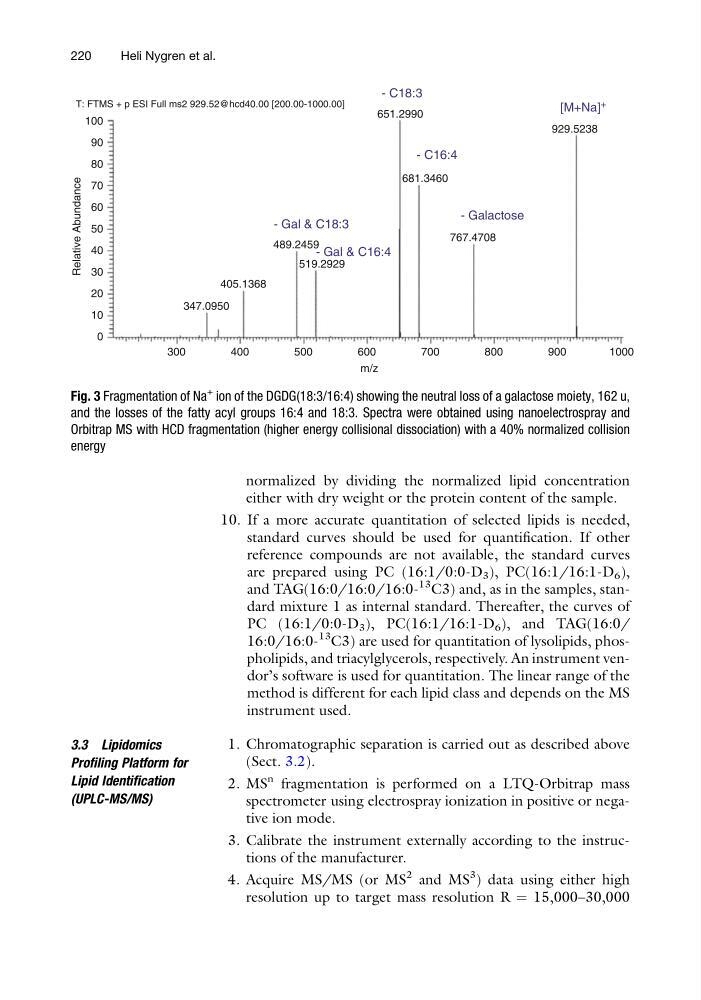
Fig. 3 Fragmentation of Na
+ ion of the DGDG(18:3/16:4) showing the neutral loss of a galactose moiety, 162 u,
and the losses of the fatty acyl groups 16:4 and 18:3. Spectra were obtained using nanoelectrospray and
Orbitrap MS with HCD fragmentation (higher energy collisional dissociation) with a 40% normalized collision
energy
220
Heli Nygren et al.
either with dry weight or the protein content of the sample.
10. If a more accurate quantitation of selected lipids is needed,
standard curves should be used for quantification. If other
reference compounds are not available, the standard curves
are prepared using PC (16:1/0:0-D 3 ), PC(16:1/16:1-D 6 ),
and TAG(16:0/16:0/16:013 C3) and, as in the samples, standard mixture 1 as internal standard. Thereafter, the curves of
PC (16:1/0:0-D 3 ), PC(16:1/16:1-D 6 ), and TAG(16:0/
16:0/16:013
C3) are used for quantitation of lysolipids, phospholipids, and triacylglycerols, respectively. An instrument vendor’s software is used for quantitation. The linear range of the
method is different for each lipid class and depends on the MS
instrument used.
3.3 Lipidomics
Profiling Platform for
Lipid Identification
(UPLC-MS/MS)
1. Chromatographic separation is carried out as described above
(Sect. 3.2).
2. MS
n fragmentation is performed on a LTQ-Orbitrap mass
spectrometer using electrospray ionization in positive or negative ion mode.
3. Calibrate the instrument externally according to the instructions of the manufacturer.
4. Acquire MS/MS (or MS
2 and MS
3
) data using either high
resolution up to target mass resolution R ¼ 15,000–30,000
300
100
400
500
600
m/z
700
800
900
1000
929.5238
767.4708
681.3460
651.2990
519.2929
489.2459
- Gal & C18:3
- C18:3
- Gal & C16:4
- C16:4
- Galactose
[M+Na] +
405.1368
T: FTMS + p ESI Full ms2 929.52@hcd40.00 [200.00-1000.00]
90
80
70
60
50
Relative Abundance
40
30
20
10
0
347.0950
Fig. 3 Fragmentation of Na
+ ion of the DGDG(18:3/16:4) showing the neutral loss of a galactose moiety, 162 u,
and the losses of the fatty acyl groups 16:4 and 18:3. Spectra were obtained using nanoelectrospray and
Orbitrap MS with HCD fragmentation (higher energy collisional dissociation) with a 40% normalized collision
energy
220
Heli Nygren et al.