

5. Inject 2 μL of lipid extract (chloroform phase).
6. Lipid compounds are detected by a Q-Tof mass spectrometer
using electrospray ionization in positive or negative ion mode
(see Notes 1 and 2).
7. Collect data in centroid mode using extended dynamic range
over a mass range of m/z 300–1200 with a scan duration of
0.2 s.
8. Process data using the MZmine 2 software [9, 10] (see Note 3)
or equivalent. Data processing includes alignment of peaks,
peak integration, normalization, and identification. Lipids are
identified using an internal spectral library or based on their
MS/MS spectra as shown in Fig. 3.
9. The data is normalized using one or more internal standards
representative of each class of lipid present in the samples: the
intensity of each identified lipid is normalized by dividing it
with the intensity of its corresponding standard and multiplying it by the concentration of the standard. All monoacyl lipids
such as monoacylglycerols and monoacylglycerophospholipids
are normalized with PC(17:0/0:0); all diacyl lipids except
ethanolamine phospholipids are normalized with PC(17:0/
17:0), all ceramides with Cer(d18:1/17:0), all diacyl ethanolamine phospholipids with PE(17:0/17:0), and TAG with TAG
(17:0/17:0/17:0) (see Note 4). Other (also unidentified)
molecular species are calibrated with PC(17:0/0:0) for retention time < 300 s, PC(17:0/17:0) for retention time between
300 and 410 s, and TAG(17:0/17:0/17:0) for higher retention times. In cell cultivation samples, lipids are further
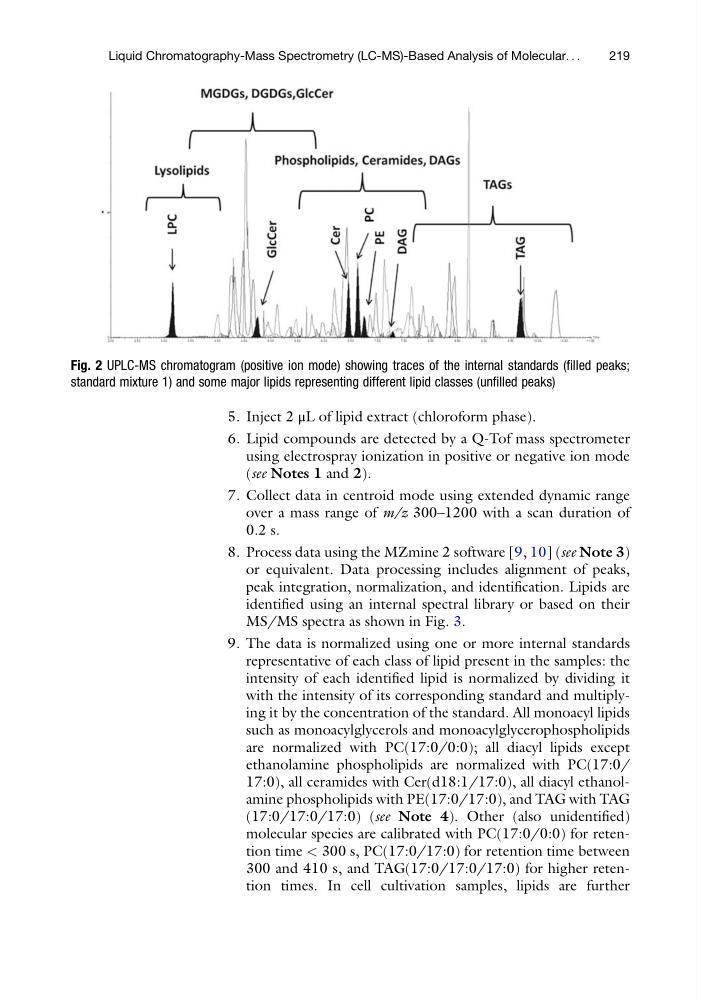
Fig. 2 UPLC-MS chromatogram (positive ion mode) showing traces of the internal standards (filled peaks;
standard mixture 1) and some major lipids representing different lipid classes (unfilled peaks)
Liquid Chromatography-Mass Spectrometry (LC-MS)-Based Analysis of Molecular. . .
219
6. Lipid compounds are detected by a Q-Tof mass spectrometer
using electrospray ionization in positive or negative ion mode
(see Notes 1 and 2).
7. Collect data in centroid mode using extended dynamic range
over a mass range of m/z 300–1200 with a scan duration of
0.2 s.
8. Process data using the MZmine 2 software [9, 10] (see Note 3)
or equivalent. Data processing includes alignment of peaks,
peak integration, normalization, and identification. Lipids are
identified using an internal spectral library or based on their
MS/MS spectra as shown in Fig. 3.
9. The data is normalized using one or more internal standards
representative of each class of lipid present in the samples: the
intensity of each identified lipid is normalized by dividing it
with the intensity of its corresponding standard and multiplying it by the concentration of the standard. All monoacyl lipids
such as monoacylglycerols and monoacylglycerophospholipids
are normalized with PC(17:0/0:0); all diacyl lipids except
ethanolamine phospholipids are normalized with PC(17:0/
17:0), all ceramides with Cer(d18:1/17:0), all diacyl ethanolamine phospholipids with PE(17:0/17:0), and TAG with TAG
(17:0/17:0/17:0) (see Note 4). Other (also unidentified)
molecular species are calibrated with PC(17:0/0:0) for retention time < 300 s, PC(17:0/17:0) for retention time between
300 and 410 s, and TAG(17:0/17:0/17:0) for higher retention times. In cell cultivation samples, lipids are further
Fig. 2 UPLC-MS chromatogram (positive ion mode) showing traces of the internal standards (filled peaks;
standard mixture 1) and some major lipids representing different lipid classes (unfilled peaks)
Liquid Chromatography-Mass Spectrometry (LC-MS)-Based Analysis of Molecular. . .
219