

78
4 Testing and Validating Against Historic Spills
0
2,000
4,000
6,000
8,000
10,000
12,000
14,000
16,000
0
500
1000
1500
Estimated mortality (indivduals)
Simulation number
0
500
1,000
1,500
2,000
2,500
0
500
1000
1500
Estimated mortality (indivduals)
Simulation number
0
20
40
60
80
100
120
140
160
180
Frequency
Estimated mortality (indivduals)
0
20
40
60
80
100
120
140
160
180
Frequency
Estimated mortality (indivduals)
P5
P50
P95
P5
P50
P95
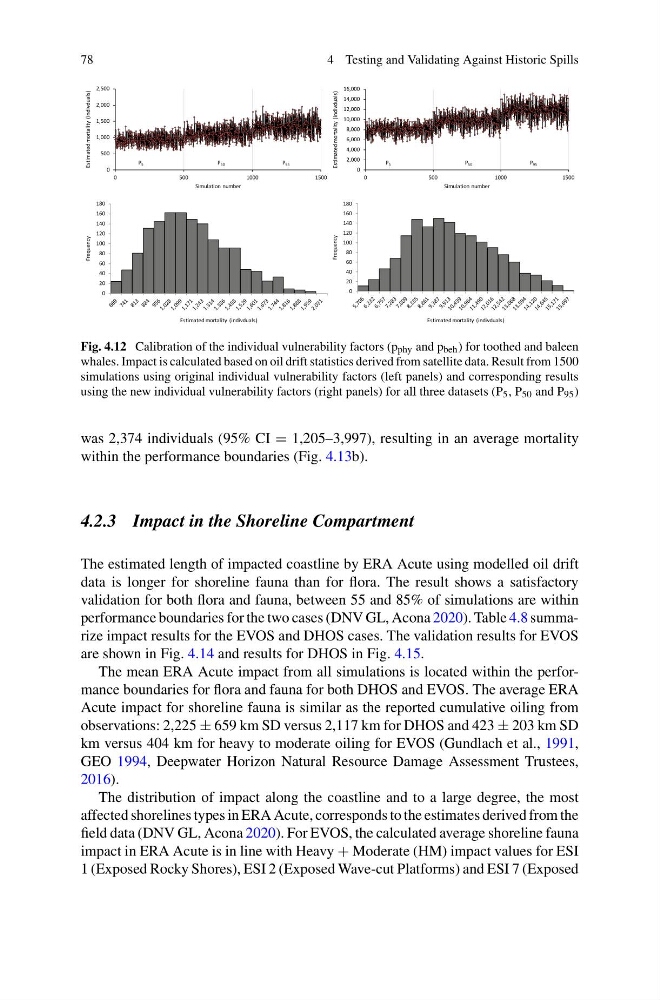
Fig. 4.12 Calibration of the individual vulnerability factors (p phy and p beh ) for toothed and baleen
whales. Impact is calculated based on oil drift statistics derived from satellite data. Result from 1500
simulations using original individual vulnerability factors (left panels) and corresponding results
using the new individual vulnerability factors (right panels) for all three datasets (P 5 , P 50 and P 95 )
was 2,374 individuals (95% CI = 1,205–3,997), resulting in an average mortality
within the performance boundaries (Fig. 4.13b).
4.2.3 Impact in the Shoreline Compartment
The estimated length of impacted coastline by ERA Acute using modelled oil drift
data is longer for shoreline fauna than for flora. The result shows a satisfactory
validation for both flora and fauna, between 55 and 85% of simulations are within
performance boundaries for the two cases (DNV GL, Acona 2020). Table 4.8 summarize impact results for the EVOS and DHOS cases. The validation results for EVOS
are shown in Fig. 4.14 and results for DHOS in Fig. 4.15.
The mean ERA Acute impact from all simulations is located within the performance boundaries for flora and fauna for both DHOS and EVOS. The average ERA
Acute impact for shoreline fauna is similar as the reported cumulative oiling from
observations: 2,225 ± 659 km SD versus 2,117 km for DHOS and 423 ± 203 km SD
km versus 404 km for heavy to moderate oiling for EVOS (Gundlach et al., 1991,
GEO 1994, Deepwater Horizon Natural Resource Damage Assessment Trustees,
2016).
The distribution of impact along the coastline and to a large degree, the most
affected shorelines types in ERA Acute, corresponds to the estimates derived from the
field data (DNV GL, Acona 2020). For EVOS, the calculated average shoreline fauna
impact in ERA Acute is in line with Heavy + Moderate (HM) impact values for ESI
1 (Exposed Rocky Shores), ESI 2 (Exposed Wave-cut Platforms) and ESI 7 (Exposed
4 Testing and Validating Against Historic Spills
0
2,000
4,000
6,000
8,000
10,000
12,000
14,000
16,000
0
500
1000
1500
Estimated mortality (indivduals)
Simulation number
0
500
1,000
1,500
2,000
2,500
0
500
1000
1500
Estimated mortality (indivduals)
Simulation number
0
20
40
60
80
100
120
140
160
180
Frequency
Estimated mortality (indivduals)
0
20
40
60
80
100
120
140
160
180
Frequency
Estimated mortality (indivduals)
P5
P50
P95
P5
P50
P95
Fig. 4.12 Calibration of the individual vulnerability factors (p phy and p beh ) for toothed and baleen
whales. Impact is calculated based on oil drift statistics derived from satellite data. Result from 1500
simulations using original individual vulnerability factors (left panels) and corresponding results
using the new individual vulnerability factors (right panels) for all three datasets (P 5 , P 50 and P 95 )
was 2,374 individuals (95% CI = 1,205–3,997), resulting in an average mortality
within the performance boundaries (Fig. 4.13b).
4.2.3 Impact in the Shoreline Compartment
The estimated length of impacted coastline by ERA Acute using modelled oil drift
data is longer for shoreline fauna than for flora. The result shows a satisfactory
validation for both flora and fauna, between 55 and 85% of simulations are within
performance boundaries for the two cases (DNV GL, Acona 2020). Table 4.8 summarize impact results for the EVOS and DHOS cases. The validation results for EVOS
are shown in Fig. 4.14 and results for DHOS in Fig. 4.15.
The mean ERA Acute impact from all simulations is located within the performance boundaries for flora and fauna for both DHOS and EVOS. The average ERA
Acute impact for shoreline fauna is similar as the reported cumulative oiling from
observations: 2,225 ± 659 km SD versus 2,117 km for DHOS and 423 ± 203 km SD
km versus 404 km for heavy to moderate oiling for EVOS (Gundlach et al., 1991,
GEO 1994, Deepwater Horizon Natural Resource Damage Assessment Trustees,
2016).
The distribution of impact along the coastline and to a large degree, the most
affected shorelines types in ERA Acute, corresponds to the estimates derived from the
field data (DNV GL, Acona 2020). For EVOS, the calculated average shoreline fauna
impact in ERA Acute is in line with Heavy + Moderate (HM) impact values for ESI
1 (Exposed Rocky Shores), ESI 2 (Exposed Wave-cut Platforms) and ESI 7 (Exposed