

4.1 Method of Validation Against Historic Spills
67
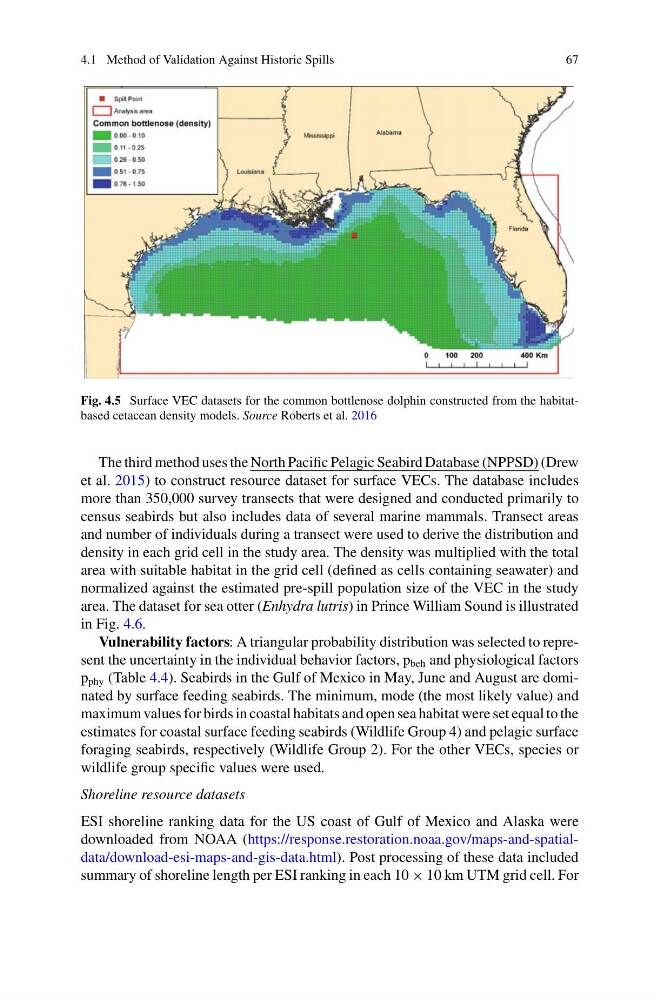
Fig. 4.5 Surface VEC datasets for the common bottlenose dolphin constructed from the habitatbased cetacean density models. Source Roberts et al. 2016
The third method uses the North Pacific Pelagic Seabird Database (NPPSD) (Drew
et al. 2015) to construct resource dataset for surface VECs. The database includes
more than 350,000 survey transects that were designed and conducted primarily to
census seabirds but also includes data of several marine mammals. Transect areas
and number of individuals during a transect were used to derive the distribution and
density in each grid cell in the study area. The density was multiplied with the total
area with suitable habitat in the grid cell (defined as cells containing seawater) and
normalized against the estimated pre-spill population size of the VEC in the study
area. The dataset for sea otter (Enhydra lutris) in Prince William Sound is illustrated
in Fig. 4.6.
Vulnerability factors: A triangular probability distribution was selected to represent the uncertainty in the individual behavior factors, p beh and physiological factors
p phy (Table 4.4). Seabirds in the Gulf of Mexico in May, June and August are dominated by surface feeding seabirds. The minimum, mode (the most likely value) and
maximum values for birds in coastal habitats and open sea habitat were set equal to the
estimates for coastal surface feeding seabirds (Wildlife Group 4) and pelagic surface
foraging seabirds, respectively (Wildlife Group 2). For the other VECs, species or
wildlife group specific values were used.
Shoreline resource datasets
ESI shoreline ranking data for the US coast of Gulf of Mexico and Alaska were
downloaded from NOAA (https://response.restoration.noaa.gov/maps-and-spatialdata/download-esi-maps-and-gis-data.html). Post processing of these data included
summary of shoreline length per ESI ranking in each 10 × 10 km UTM grid cell. For
67
Fig. 4.5 Surface VEC datasets for the common bottlenose dolphin constructed from the habitatbased cetacean density models. Source Roberts et al. 2016
The third method uses the North Pacific Pelagic Seabird Database (NPPSD) (Drew
et al. 2015) to construct resource dataset for surface VECs. The database includes
more than 350,000 survey transects that were designed and conducted primarily to
census seabirds but also includes data of several marine mammals. Transect areas
and number of individuals during a transect were used to derive the distribution and
density in each grid cell in the study area. The density was multiplied with the total
area with suitable habitat in the grid cell (defined as cells containing seawater) and
normalized against the estimated pre-spill population size of the VEC in the study
area. The dataset for sea otter (Enhydra lutris) in Prince William Sound is illustrated
in Fig. 4.6.
Vulnerability factors: A triangular probability distribution was selected to represent the uncertainty in the individual behavior factors, p beh and physiological factors
p phy (Table 4.4). Seabirds in the Gulf of Mexico in May, June and August are dominated by surface feeding seabirds. The minimum, mode (the most likely value) and
maximum values for birds in coastal habitats and open sea habitat were set equal to the
estimates for coastal surface feeding seabirds (Wildlife Group 4) and pelagic surface
foraging seabirds, respectively (Wildlife Group 2). For the other VECs, species or
wildlife group specific values were used.
Shoreline resource datasets
ESI shoreline ranking data for the US coast of Gulf of Mexico and Alaska were
downloaded from NOAA (https://response.restoration.noaa.gov/maps-and-spatialdata/download-esi-maps-and-gis-data.html). Post processing of these data included
summary of shoreline length per ESI ranking in each 10 × 10 km UTM grid cell. For