

2.5 Risk Mitigation and Net Environmental Benefit Assessments
29
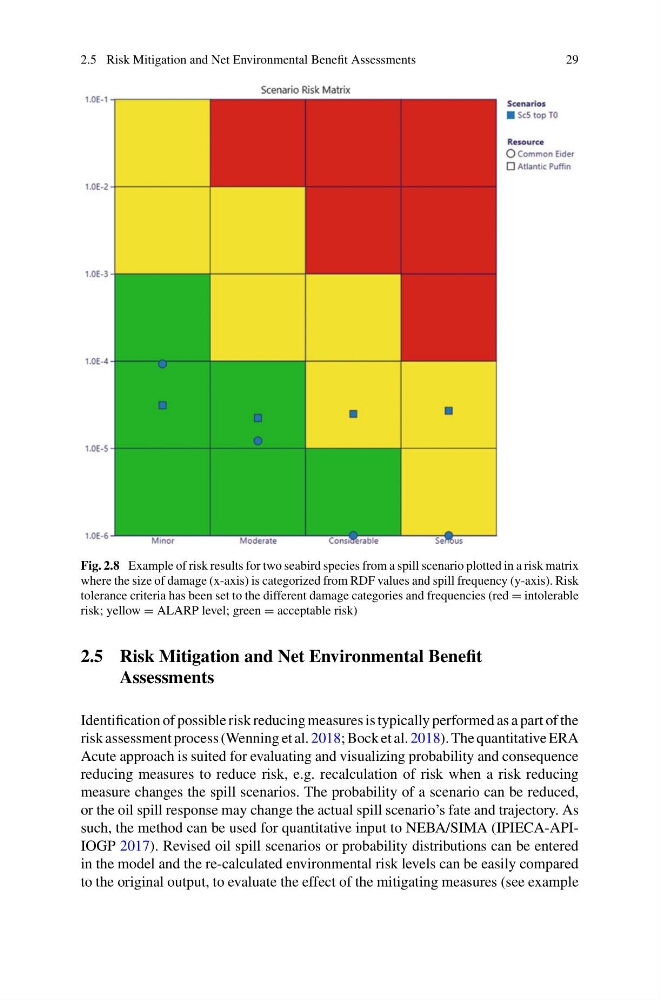
Fig. 2.8 Example of risk results for two seabird species from a spill scenario plotted in a risk matrix
where the size of damage (x-axis) is categorized from RDF values and spill frequency (y-axis). Risk
tolerance criteria has been set to the different damage categories and frequencies (red = intolerable
risk; yellow = ALARP level; green = acceptable risk)
2.5 Risk Mitigation and Net Environmental Benefit
Assessments
Identification of possible risk reducing measures is typically performed as a part of the
risk assessment process (Wenning et al. 2018; Bock et al. 2018). The quantitative ERA
Acute approach is suited for evaluating and visualizing probability and consequence
reducing measures to reduce risk, e.g. recalculation of risk when a risk reducing
measure changes the spill scenarios. The probability of a scenario can be reduced,
or the oil spill response may change the actual spill scenario’s fate and trajectory. As
such, the method can be used for quantitative input to NEBA/SIMA (IPIECA-APIIOGP 2017). Revised oil spill scenarios or probability distributions can be entered
in the model and the re-calculated environmental risk levels can be easily compared
to the original output, to evaluate the effect of the mitigating measures (see example
29
Fig. 2.8 Example of risk results for two seabird species from a spill scenario plotted in a risk matrix
where the size of damage (x-axis) is categorized from RDF values and spill frequency (y-axis). Risk
tolerance criteria has been set to the different damage categories and frequencies (red = intolerable
risk; yellow = ALARP level; green = acceptable risk)
2.5 Risk Mitigation and Net Environmental Benefit
Assessments
Identification of possible risk reducing measures is typically performed as a part of the
risk assessment process (Wenning et al. 2018; Bock et al. 2018). The quantitative ERA
Acute approach is suited for evaluating and visualizing probability and consequence
reducing measures to reduce risk, e.g. recalculation of risk when a risk reducing
measure changes the spill scenarios. The probability of a scenario can be reduced,
or the oil spill response may change the actual spill scenario’s fate and trajectory. As
such, the method can be used for quantitative input to NEBA/SIMA (IPIECA-APIIOGP 2017). Revised oil spill scenarios or probability distributions can be entered
in the model and the re-calculated environmental risk levels can be easily compared
to the original output, to evaluate the effect of the mitigating measures (see example