

2.3 Environmental Risk Screening
23
The output from stochastic oil drift modelling provides a statistical overview of
oil spill trajectories and to what extent certain areas could be exposed to harmful oil.
Without saying anything about the presence of sensitive resources or habitats, and
just by analyzing the results from a high number of different oil spill trajectories,
the screening process can highlight areas and periods of environmental concern in
different environmental compartments. This is denoted level A.1 (see Sect. 1.3.3.1).
The ERA Acute software tool can visualize important features from the oil spill
modelling such as probabilities of oiling above an effect threshold value (i.e. surface
oil film thickness or water column concentration), and statistical parameters such
as minimum, mean and maximum values of oil volumes and concentrations in
geographic areas. All oil spill parameters can be visualized in a map in an ERA
Acute screening assessment. The risk screening can as such define the boundaries
for further detailed impact and risk assessments, provide insight into the needs for
further data gathering or inform concept selection in an early stage without extensive
assessment approaches.
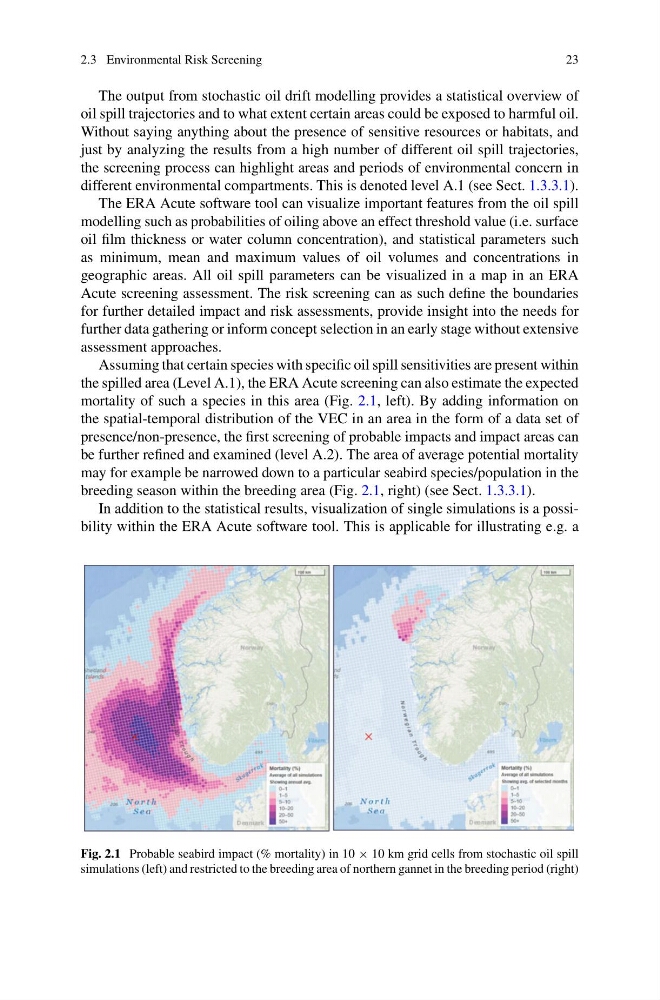
Assuming that certain species with specific oil spill sensitivities are present within
the spilled area (Level A.1), the ERA Acute screening can also estimate the expected
mortality of such a species in this area (Fig. 2.1, left). By adding information on
the spatial-temporal distribution of the VEC in an area in the form of a data set of
presence/non-presence, the first screening of probable impacts and impact areas can
be further refined and examined (level A.2). The area of average potential mortality
may for example be narrowed down to a particular seabird species/population in the
breeding season within the breeding area (Fig. 2.1, right) (see Sect. 1.3.3.1).
In addition to the statistical results, visualization of single simulations is a possibility within the ERA Acute software tool. This is applicable for illustrating e.g. a
Fig. 2.1 Probable seabird impact (% mortality) in 10 × 10 km grid cells from stochastic oil spill
simulations (left) and restricted to the breeding area of northern gannet in the breeding period (right)
23
The output from stochastic oil drift modelling provides a statistical overview of
oil spill trajectories and to what extent certain areas could be exposed to harmful oil.
Without saying anything about the presence of sensitive resources or habitats, and
just by analyzing the results from a high number of different oil spill trajectories,
the screening process can highlight areas and periods of environmental concern in
different environmental compartments. This is denoted level A.1 (see Sect. 1.3.3.1).
The ERA Acute software tool can visualize important features from the oil spill
modelling such as probabilities of oiling above an effect threshold value (i.e. surface
oil film thickness or water column concentration), and statistical parameters such
as minimum, mean and maximum values of oil volumes and concentrations in
geographic areas. All oil spill parameters can be visualized in a map in an ERA
Acute screening assessment. The risk screening can as such define the boundaries
for further detailed impact and risk assessments, provide insight into the needs for
further data gathering or inform concept selection in an early stage without extensive
assessment approaches.
Assuming that certain species with specific oil spill sensitivities are present within
the spilled area (Level A.1), the ERA Acute screening can also estimate the expected
mortality of such a species in this area (Fig. 2.1, left). By adding information on
the spatial-temporal distribution of the VEC in an area in the form of a data set of
presence/non-presence, the first screening of probable impacts and impact areas can
be further refined and examined (level A.2). The area of average potential mortality
may for example be narrowed down to a particular seabird species/population in the
breeding season within the breeding area (Fig. 2.1, right) (see Sect. 1.3.3.1).
In addition to the statistical results, visualization of single simulations is a possibility within the ERA Acute software tool. This is applicable for illustrating e.g. a
Fig. 2.1 Probable seabird impact (% mortality) in 10 × 10 km grid cells from stochastic oil spill
simulations (left) and restricted to the breeding area of northern gannet in the breeding period (right)