

98
5 Handling Uncertainty and Sensitivity …
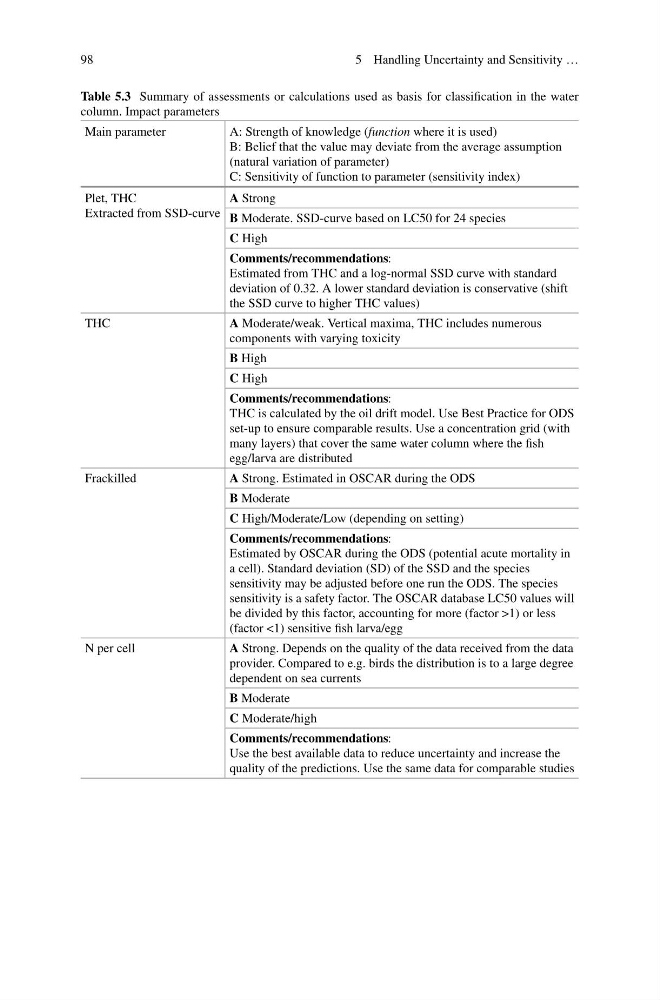
Table 5.3 Summary of assessments or calculations used as basis for classification in the water
column. Impact parameters
Main parameter
A: Strength of knowledge (function where it is used)
B: Belief that the value may deviate from the average assumption
(natural variation of parameter)
C: Sensitivity of function to parameter (sensitivity index)
Plet, THC
Extracted from SSD-curve
A Strong
B Moderate. SSD-curve based on LC50 for 24 species
C High
Comments/recommendations:
Estimated from THC and a log-normal SSD curve with standard
deviation of 0.32. A lower standard deviation is conservative (shift
the SSD curve to higher THC values)
THC
A Moderate/weak. Vertical maxima, THC includes numerous
components with varying toxicity
B High
C High
Comments/recommendations:
THC is calculated by the oil drift model. Use Best Practice for ODS
set-up to ensure comparable results. Use a concentration grid (with
many layers) that cover the same water column where the fish
egg/larva are distributed
Frackilled
A Strong. Estimated in OSCAR during the ODS
B Moderate
C High/Moderate/Low (depending on setting)
Comments/recommendations:
Estimated by OSCAR during the ODS (potential acute mortality in
a cell). Standard deviation (SD) of the SSD and the species
sensitivity may be adjusted before one run the ODS. The species
sensitivity is a safety factor. The OSCAR database LC50 values will
be divided by this factor, accounting for more (factor >1) or less
(factor <1) sensitive fish larva/egg
N per cell
A Strong. Depends on the quality of the data received from the data
provider. Compared to e.g. birds the distribution is to a large degree
dependent on sea currents
B Moderate
C Moderate/high
Comments/recommendations:
Use the best available data to reduce uncertainty and increase the
quality of the predictions. Use the same data for comparable studies
5 Handling Uncertainty and Sensitivity …
Table 5.3 Summary of assessments or calculations used as basis for classification in the water
column. Impact parameters
Main parameter
A: Strength of knowledge (function where it is used)
B: Belief that the value may deviate from the average assumption
(natural variation of parameter)
C: Sensitivity of function to parameter (sensitivity index)
Plet, THC
Extracted from SSD-curve
A Strong
B Moderate. SSD-curve based on LC50 for 24 species
C High
Comments/recommendations:
Estimated from THC and a log-normal SSD curve with standard
deviation of 0.32. A lower standard deviation is conservative (shift
the SSD curve to higher THC values)
THC
A Moderate/weak. Vertical maxima, THC includes numerous
components with varying toxicity
B High
C High
Comments/recommendations:
THC is calculated by the oil drift model. Use Best Practice for ODS
set-up to ensure comparable results. Use a concentration grid (with
many layers) that cover the same water column where the fish
egg/larva are distributed
Frackilled
A Strong. Estimated in OSCAR during the ODS
B Moderate
C High/Moderate/Low (depending on setting)
Comments/recommendations:
Estimated by OSCAR during the ODS (potential acute mortality in
a cell). Standard deviation (SD) of the SSD and the species
sensitivity may be adjusted before one run the ODS. The species
sensitivity is a safety factor. The OSCAR database LC50 values will
be divided by this factor, accounting for more (factor >1) or less
(factor <1) sensitive fish larva/egg
N per cell
A Strong. Depends on the quality of the data received from the data
provider. Compared to e.g. birds the distribution is to a large degree
dependent on sea currents
B Moderate
C Moderate/high
Comments/recommendations:
Use the best available data to reduce uncertainty and increase the
quality of the predictions. Use the same data for comparable studies