

96
5 Handling Uncertainty and Sensitivity …
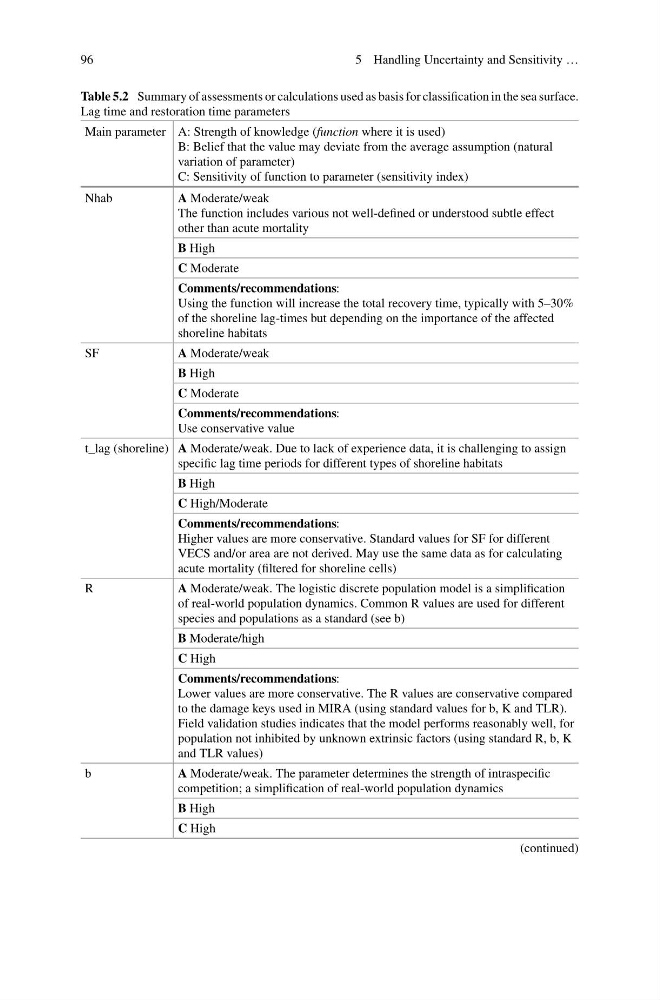
Table 5.2 Summary of assessments or calculations used as basis for classification in the sea surface.
Lag time and restoration time parameters
Main parameter A: Strength of knowledge (function where it is used)
B: Belief that the value may deviate from the average assumption (natural
variation of parameter)
C: Sensitivity of function to parameter (sensitivity index)
Nhab
A Moderate/weak
The function includes various not well-defined or understood subtle effect
other than acute mortality
B High
C Moderate
Comments/recommendations:
Using the function will increase the total recovery time, typically with 5–30%
of the shoreline lag-times but depending on the importance of the affected
shoreline habitats
SF
A Moderate/weak
B High
C Moderate
Comments/recommendations:
Use conservative value
t_lag (shoreline) A Moderate/weak. Due to lack of experience data, it is challenging to assign
specific lag time periods for different types of shoreline habitats
B High
C High/Moderate
Comments/recommendations:
Higher values are more conservative. Standard values for SF for different
VECS and/or area are not derived. May use the same data as for calculating
acute mortality (filtered for shoreline cells)
R
A Moderate/weak. The logistic discrete population model is a simplification
of real-world population dynamics. Common R values are used for different
species and populations as a standard (see b)
B Moderate/high
C High
Comments/recommendations:
Lower values are more conservative. The R values are conservative compared
to the damage keys used in MIRA (using standard values for b, K and TLR).
Field validation studies indicates that the model performs reasonably well, for
population not inhibited by unknown extrinsic factors (using standard R, b, K
and TLR values)
b
A Moderate/weak. The parameter determines the strength of intraspecific
competition; a simplification of real-world population dynamics
B High
C High
(continued)
5 Handling Uncertainty and Sensitivity …
Table 5.2 Summary of assessments or calculations used as basis for classification in the sea surface.
Lag time and restoration time parameters
Main parameter A: Strength of knowledge (function where it is used)
B: Belief that the value may deviate from the average assumption (natural
variation of parameter)
C: Sensitivity of function to parameter (sensitivity index)
Nhab
A Moderate/weak
The function includes various not well-defined or understood subtle effect
other than acute mortality
B High
C Moderate
Comments/recommendations:
Using the function will increase the total recovery time, typically with 5–30%
of the shoreline lag-times but depending on the importance of the affected
shoreline habitats
SF
A Moderate/weak
B High
C Moderate
Comments/recommendations:
Use conservative value
t_lag (shoreline) A Moderate/weak. Due to lack of experience data, it is challenging to assign
specific lag time periods for different types of shoreline habitats
B High
C High/Moderate
Comments/recommendations:
Higher values are more conservative. Standard values for SF for different
VECS and/or area are not derived. May use the same data as for calculating
acute mortality (filtered for shoreline cells)
R
A Moderate/weak. The logistic discrete population model is a simplification
of real-world population dynamics. Common R values are used for different
species and populations as a standard (see b)
B Moderate/high
C High
Comments/recommendations:
Lower values are more conservative. The R values are conservative compared
to the damage keys used in MIRA (using standard values for b, K and TLR).
Field validation studies indicates that the model performs reasonably well, for
population not inhibited by unknown extrinsic factors (using standard R, b, K
and TLR values)
b
A Moderate/weak. The parameter determines the strength of intraspecific
competition; a simplification of real-world population dynamics
B High
C High
(continued)