

24
2 Actual Potentials of Theoretical Chemistry: What Can Be Obtained
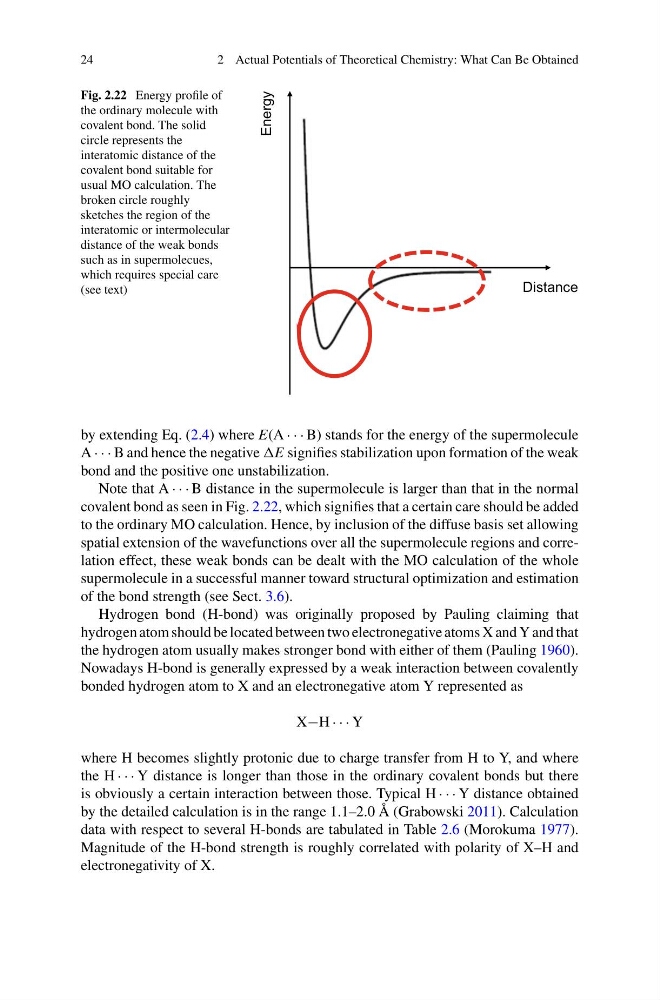
Fig. 2.22 Energy profile of
the ordinary molecule with
covalent bond. The solid
circle represents the
interatomic distance of the
covalent bond suitable for
usual MO calculation. The
broken circle roughly
sketches the region of the
interatomic or intermolecular
distance of the weak bonds
such as in supermolecues,
which requires special care
(see text)
Energy
Distance
by extending Eq. (2.4) where E(A · · · B) stands for the energy of the supermolecule
A · · · B and hence the negative signifies stabilization upon formation of the weak
bond and the positive one unstabilization.
Note that A · · · B distance in the supermolecule is larger than that in the normal
covalent bond as seen in Fig. 2.22, which signifies that a certain care should be added
to the ordinary MO calculation. Hence, by inclusion of the diffuse basis set allowing
spatial extension of the wavefunctions over all the supermolecule regions and correlation effect, these weak bonds can be dealt with the MO calculation of the whole
supermolecule in a successful manner toward structural optimization and estimation
of the bond strength (see Sect. 3.6).
Hydrogen bond (H-bond) was originally proposed by Pauling claiming that
hydrogen atom should be located between two electronegative atoms X and Y and that
the hydrogen atom usually makes stronger bond with either of them (Pauling 1960).
Nowadays H-bond is generally expressed by a weak interaction between covalently
bonded hydrogen atom to X and an electronegative atom Y represented as
X−H · · · Y
where H becomes slightly protonic due to charge transfer from H to Y, and where
the H · · · Y distance is longer than those in the ordinary covalent bonds but there
is obviously a certain interaction between those. Typical H · · · Y distance obtained
by the detailed calculation is in the range 1.1–2.0 Å (Grabowski 2011). Calculation
data with respect to several H-bonds are tabulated in Table 2.6 (Morokuma 1977).
Magnitude of the H-bond strength is roughly correlated with polarity of X–H and
electronegativity of X.
2 Actual Potentials of Theoretical Chemistry: What Can Be Obtained
Fig. 2.22 Energy profile of
the ordinary molecule with
covalent bond. The solid
circle represents the
interatomic distance of the
covalent bond suitable for
usual MO calculation. The
broken circle roughly
sketches the region of the
interatomic or intermolecular
distance of the weak bonds
such as in supermolecues,
which requires special care
(see text)
Energy
Distance
by extending Eq. (2.4) where E(A · · · B) stands for the energy of the supermolecule
A · · · B and hence the negative signifies stabilization upon formation of the weak
bond and the positive one unstabilization.
Note that A · · · B distance in the supermolecule is larger than that in the normal
covalent bond as seen in Fig. 2.22, which signifies that a certain care should be added
to the ordinary MO calculation. Hence, by inclusion of the diffuse basis set allowing
spatial extension of the wavefunctions over all the supermolecule regions and correlation effect, these weak bonds can be dealt with the MO calculation of the whole
supermolecule in a successful manner toward structural optimization and estimation
of the bond strength (see Sect. 3.6).
Hydrogen bond (H-bond) was originally proposed by Pauling claiming that
hydrogen atom should be located between two electronegative atoms X and Y and that
the hydrogen atom usually makes stronger bond with either of them (Pauling 1960).
Nowadays H-bond is generally expressed by a weak interaction between covalently
bonded hydrogen atom to X and an electronegative atom Y represented as
X−H · · · Y
where H becomes slightly protonic due to charge transfer from H to Y, and where
the H · · · Y distance is longer than those in the ordinary covalent bonds but there
is obviously a certain interaction between those. Typical H · · · Y distance obtained
by the detailed calculation is in the range 1.1–2.0 Å (Grabowski 2011). Calculation
data with respect to several H-bonds are tabulated in Table 2.6 (Morokuma 1977).
Magnitude of the H-bond strength is roughly correlated with polarity of X–H and
electronegativity of X.